4 Metrics to Get the Most Value Out of Your Fleet Assets
Performance monitoring and replacement criteria go hand in hand to ensure maximum asset ROI, but what metrics should be included, and in what ways can they inform replacement cycles? Today, we’re discussing tips for tracking and improving performance metrics and using related data to build a strategic replacement plan.
Jun 17, 2024
7 min read
Data plays a large role in effective fleet management, but knowing what metrics to track for informed decision-making can be challenging. When it comes to monitoring asset performance, multiple data points should be considered to fully understand how an asset is performing — including how its performance impacts the bottom line — and whether its value outweighs the cost of running it.
Why Monitoring Asset Performance Matters
Poorly performing assets aren’t constrained to a bubble; rather, they impact multiple operations and cost centers. An asset that isn’t quite up to snuff — let’s say it’s in the shop once a month for a recurring issue — can affect fuel and service costs, cause productivity loss and can negatively impact both employee and client/customer satisfaction.
Downtime management and optimizing asset replacement cycles are two of the main goals of fleet management, and performance monitoring plays an important role here. It allows fleets to quickly surface problem assets that are becoming money pits — including the reason for the increased costs. This helps determine whether assets’ useful life can be reasonably and safely extended, or whether replacing fleet vehicles is the best option.
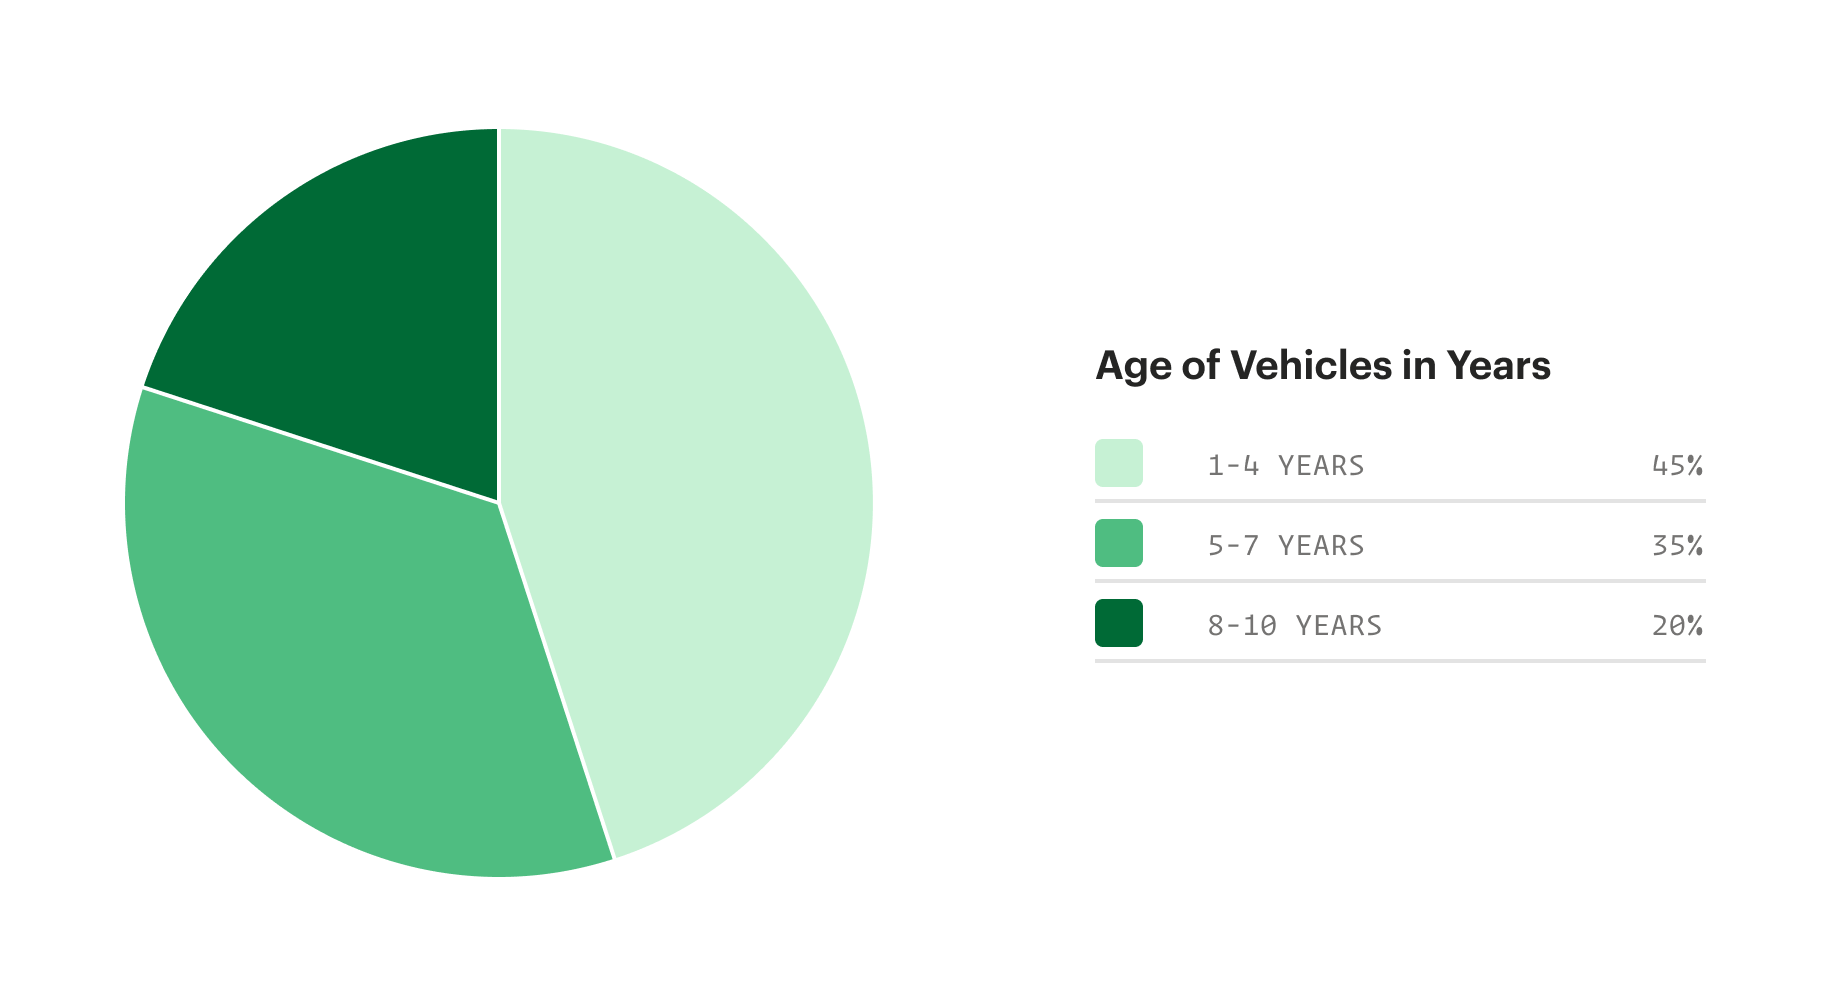
Fleet benchmarks are a great way to compare your assets’ performance within the industry you serve, and can help inform trouble areas that need improving. Additionally, fleets can benchmark against themselves to see how much or how little the corrective actions they take are impacting asset performance, leading to better decisions around asset lifecycle and replacement.
How Does Your Fleet Stack Up?
Benchmarking is a great way to see how your fleet operation compares to others’, and can provide insights on problem areas that need addressing. Curious how your fleet stacks up?
Take a look
Metrics for Performance Tracking
As previously mentioned, monitoring fleet performance entails pulling multiple data points, but it also consists of consolidating that data to gain a clear picture of performance on an asset-by-asset basis. Key performance metrics should include:
1. Asset Usage
Tracking asset usage has become more prevalent now that easier methods of doing so are available. Fleets can still track usage manually, of course, by pulling odometer/hours readings from vehicles and equipment, cross-referencing asset assignment logs against asset check-in/outs and cross-referencing fuel consumption against hours logged, odometer readings and asset assignments. Fleets can gain more precise usage insights using fleet technologies, like fleet management software (FMS), which integrates with telematics devices to track such usage-related data as ignition start and cutoff, including hours run in between, distance traveled and true versus operational idle time.
Tracking vehicle idle time and discerning between true and operational idle time can help you determine where unnecessary idling can be cut down, whether through route optimization, driver coaching or using proper on-site tools and equipment, while monitoring operational idle time surfaces which assets may be over or under used, allowing you to adjust usage to maximize asset lifespan.

For Fleetio Users
You can find asset usage rates and lifecycle details in Utilization Summary reports. Compare estimated usage rates against actual usage by either timeline, meter or assignments.
2. Inspection and Service Histories
Inspection and service histories — including work orders — play a significant role in performance evaluation and asset health analysis. Fleets can compare assets’ preventive maintenance (PM) schedules against service histories to highlight discrepancies in scheduled versus unscheduled maintenance. Let’s go back to the example of an asset that’s in the shop once a month; using service histories in conjunction with the asset’s inspection history allows fleets to quickly pick up on trends affecting the asset’s performance, which could be caused by anything from missing (or not reporting) an issue with the component in question during inspections to installing parts brands that aren’t up to daily operations.
Fleets can use FMS integrated with telematics to dive even deeper into poor performing assets by using sensor data pulled directly from the vehicle. This enables fleets to determine if the recurring failure of a component is due to an underlying issue that has been overlooked. If after ruling out all other possible causes and solutions — such as those stated above — an asset is still consistently performing poorly, it might be time for a replacement.
For Fleetio Users
The Operating Costs Summary in the reports tab can be the first to show unexpected or high expenses. From there, pull the ‘big three’ to help source cost inflation: Inspection Failures List, Faults Summary and Service History by Vehicle.
3. Fuel Consumption
Tracking fuel consumption provides a wealth of useful information pertaining to asset performance and can help fleets pinpoint the cause of consumption increases. If you’re looking at your hour meter or odometer reading reports and the associated fuel consumption for the asset in question is too high or too low, there may be an issue.
Having a baseline fuel consumption threshold for each asset allows you to compare actual versus estimated consumption by job, route or hours in use, which can help fleets really dive into problem areas with confidence. By consistently tracking your fleet assets’ fuel spend and comparing assets’ projected average mpg to their actual mpg, you can start picking up on red flags. Some discrepancies can point to fuel theft/misuse or a natural decline as the asset ages; however, additional causes include increased fuel consumption due to extended idle times, speeding and erratic driving.
For Fleetio Users
When adding a vehicle to Fleetio via VIN decoder, an asset’s OEM-estimated fuel economy will be included in the Vehicle Details report. Compare this to the asset’s Fuel Summary and Fuel Entries report to narrow down the culprit of increased fuel spend.
4. Driver Behavior
Speaking of driving behaviors, “Analysis by the Massachusetts Institute of Technology shows that aggressive driving behavior, characterized by speeding and rapid acceleration and braking, can lower fuel economy by 15%–30% at highway speeds and 10%–40% in stop-and-go traffic,” according to the U.S. Department of Energy. But the cost of poor driver behavior doesn’t stop there, as it can also damage or increase wear and tear on asset components, leading to increased maintenance cycles or the ever-dreaded downtime. In short, driver behavior has a direct impact on asset performance.
Fleets can use FMS with telematics integrations to monitor driver behavior in real time by tracking such behaviors as speeding and harsh acceleration, braking and cornering. Many telematics services have also made dash cams available to better monitor what’s going on in the cab and on the road. Dash cams are a great way to get a better picture of unwanted driving behaviors and their cause, and they can provide a better idea of how unwanted driver behaviors are impacting your fleet from cost, performance and lost revenue standpoints.
For Fleetio Users
You can check Vehicle Assignment Logs and Vehicle Assignment Histories against high-cost assets to find trends, or integrate your telematics into Fleetio for fuel and driver behavior data collected directly from the asset.
All these data points work together to show how well an asset is performing within its projected useful life and how it compares to both industry and internal benchmarks. This, in turn, grants valuable insight into whether it’s worth it to prolong an asset’s useful life or if adjusting replacement cycles based on performance is necessary.
Why Performance-based Replacement Cycles?
Sure, vehicle lifecycle management can be tricky, and for many assets, a generic replacement cycle based on age or mileage will be just the ticket. Performance-based replacement cycles, however, help determine when to replace a vehicle based on its value to the fleet and business as a whole. An asset that’s been run particularly hard — whether because of the nature of the job, the working environment or just plain ole aggressive driving — has a greater chance at early retirement due to increased operating costs.
While choosing to retire an asset early doesn’t sound ideal, it can actually result in improved safety, uptime and cost savings. Plus, comparing an asset’s real-time performance metrics against its projected fleet vehicle lifecycle makes it easier to spot potential issues early for timely correction. All in all, performance-based replacement cycles can help ensure fleets are getting the best bang for their buck — whether through safely extending an asset’s useful life or making the decision to kick it to the curb.
Track, Measure, Report
Fleetio makes data analysis easy with comprehensive, configurable reports right at your fingertips. Quickly view performance metrics reports and easily share results with stakeholders.
Learn more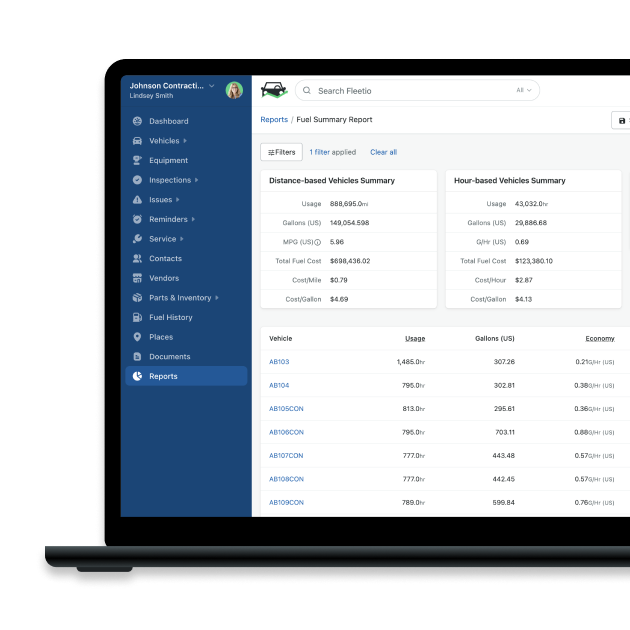

Senior Fleet Content Specialist
As a Senior Fleet Content Specialist at Fleetio, Rachael Plant uses her near decade of industry experience to craft practical content aimed at helping fleet professionals tackle everyday challenges with confidence.
LinkedIn|View articles by Rachael PlantReady to get started?
Join thousands of satisfied customers using Fleetio
Questions? Call us at 1-800-975-5304