How to Build an EV Fleet Transition Plan for the Long Middle
Most EV transition guides stop at delivery day. The hard part starts after, when ICE and electric assets share a roster for years. Here is how to screen candidates, build a TCO model finance will sign off on and run both energy types from one record.
Sep 11, 2026
12 min read

What you need to know
- EV decisions live at the asset level, not the fleet level. Per-asset fuel spend, utilization and maintenance history surface the units that should go first and the ones that should wait. Fleet-wide averages hide both signals.
- Start infrastructure planning 9 to 36 months before the first EV arrives. Utility energization is the longest lead item in any transition, and it does not compress because your vehicles showed up early.
- A TCO model without infrastructure costs will not survive finance. Site electrical upgrades, charger procurement and demand charge exposure can push parity five to ten years later for some segments.
- The phase most guides skip is the long middle. Running ICE and electric assets side by side lasts years and demands one system of record for both energy types.
Most EV transition guides end at delivery day. That is the easy part. The hard part is the stretch that follows, where a manager tracks two cost streams, two refueling workflows and two maintenance playbooks across a single roster, and has to justify the next replacement decision with numbers that hold up.
Before any asset gets ordered or any charger gets quoted, the most productive thing you can do is bring every asset's operational data into a single view. Fuel spend, cost per mile, maintenance history, utilization rates and route data all visible together, by asset, so you can compare what each unit actually costs to operate against what it would cost to replace.
Electrification Decisions Live at the Asset Level
A fleet of 40 mixed-use vans is not one electrification question. It is 40 questions about duty cycle fit, replacement timing and cost trajectory, and the answers vary considerably across those assets. Managers who decide from fleet-wide averages routinely obscure the units that should go first while overstating the case for units that should wait.
The data you need is almost certainly already being generated. Fuel transactions record consumption and cost. Maintenance work orders capture parts, labor and downtime. Telematics logs routes and distance. The problem is rarely collection. It is that those three streams live in three places, and nobody reconciles them by asset.
Centralizing them is the operational prerequisite for every decision that follows, from identifying first-wave candidates to building a capital budget proposal that survives a board presentation. Until fuel, maintenance and utilization data sit on the same asset record, an electrification plan is an opinion with a spreadsheet attached.
How to Screen Routes and Duty Cycles for Your First EV Candidates
Once asset-level data is in one place, the first filter is duty cycle fit. Most fleets assume their routes are too variable or too long for EVs, and that assumption frequently falls apart against actual telematics data. ICCT research finds that nearly all Class 2b-3 commercial vehicles travel under 200 miles per day, which puts the majority of light- and medium-duty route profiles within range of commercially available electric assets today.
Apply a consistent set of criteria to each asset rather than eyeballing the roster.
- Daily mileage consistency. Pull the last 12 months of telematics data and look at actual miles driven per shift, not planned route distance. Assets with low variance are the strongest candidates because range planning becomes predictable.
- Overnight dwell availability. The IEA's Global EV Outlook 2025 confirms that heavy-duty electrification phases in beginning with depot charging, with en-route infrastructure following later. An asset that returns to a controlled facility overnight can charge during the dwell window.
- Payload and towing requirements. Gross vehicle weight rating and payload demands determine which electric models are technically viable. Cross-referencing your asset specs against available models in the same weight class narrows the pool quickly.
- Maintenance cost trajectory. Assets with high and rising maintenance costs belong at the front of the queue. High fuel spend plus frequent repairs strengthens the financial case and shortens the payback period on a higher sticker price.
- Route predictability. Fixed delivery circuits and daily commuter transport are better candidates than reactively dispatched assets. Predictable duty cycles reduce range risk and make charge planning straightforward.
Pro Tip
Run the screen before you take a single procurement or infrastructure call. Vendors will size a proposal against your total asset count. Your realistic first cohort is usually a fraction of that, and walking in with the shortlist changes the conversation from how many can we sell you to which ones actually fit.
Running this screen against existing utilization data surfaces a realistic first cohort before you spend time on quotes. It also produces the list you will defend in the next meeting.
Build a TCO Model That Survives Your Board Meeting
Identifying which assets fit an EV duty cycle is an operational question. Proving the financial case is a different discipline, and the most common failure point is a Total Cost of Ownership (TCO) model that accounts for purchase price and fuel savings but ignores infrastructure entirely.
ICCT research finds that infrastructure costs alone can push TCO parity five to ten years later for some fleet segments. A business case that presents an EV's lower per-mile energy cost without accounting for site electrical upgrades, charger procurement, installation and potential demand charge increases will collapse under a CFO's review.
A defensible model needs four inputs alongside the acquisition price, each calculated per asset.
- Energy cost per mile driven. Not a blended utility rate. The rate you will actually pay at the hours you will actually charge.
- Expected maintenance cost reduction measured against the incumbent asset's own repair history, not an industry average.
- Infrastructure capital allocated per asset, calculated as charger and site cost divided by the number of assets that port will serve.
- Ongoing demand charge exposure at your depot, which is a recurring operating cost rather than a one-time capital line.
Ozark Regional Transit built this kind of analysis for its public transit fleet.
"When you're looking at cost per mile driven... How much is this van costing me per mile?... It's no longer just a procurement decision... you now get to look into the full cost of the lifecycle of the vehicles." Bryan Martin, Maintenance Director at Ozark Regional Transit
That discipline is exactly what an EV replacement conversation requires, because sticker price is only the beginning of the comparison. Asset-level visibility turns a recommendation from a judgment call into a capital argument with specific numbers behind it.
Sometimes the honest model shows that an asset class does not pencil out yet. IEA data notes that in some heavy-duty categories, battery electric trucks have not reached TCO parity with diesel equivalents. Say so. A plan that names where the economics do not work is far more credible on the assets where they do.
Every cost, every asset, one record
Fuel, energy, parts, labor and downtime tied to individual assets. That is the foundation a defensible TCO model is built on.
Request a demo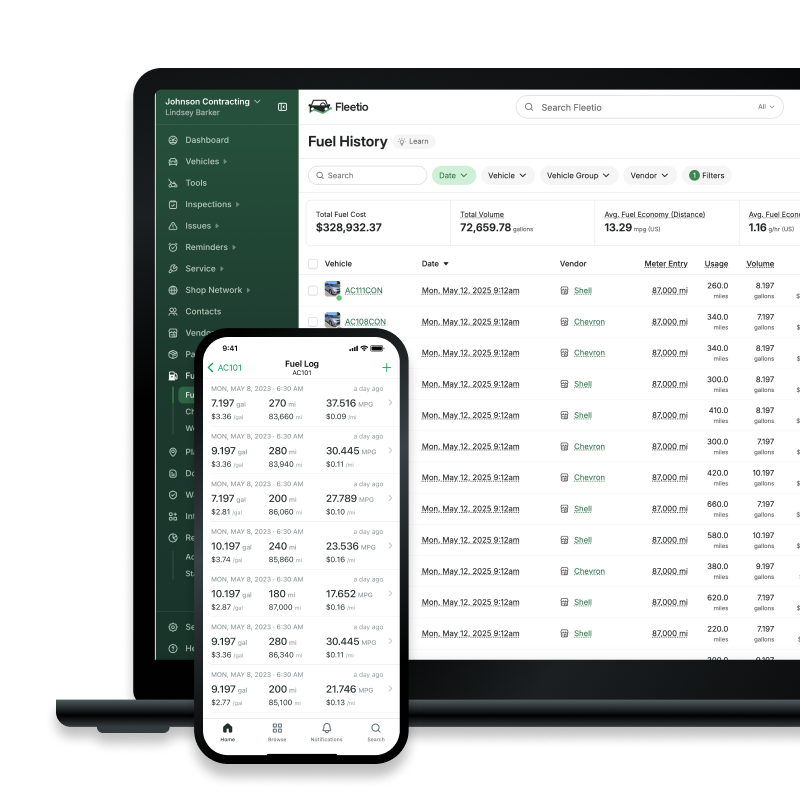
Start Charging Infrastructure Planning 9 to 36 Months Before Your First EV Arrives
Electrical infrastructure, specifically the utility work required to bring adequate power to your depot, carries the longest lead time in any transition. Vehicles can be ordered in weeks. Grid capacity cannot.
NACFE research on electric truck depots documents that across ten fleets growing their battery-electric populations, energizing infrastructure took nine to 36 months. The EPA Inspector General found that establishing charging stations and connecting them to power lines could take 12 to 24 months, putting Clean School Bus Program delivery timelines at risk. Fleets that begin infrastructure conversations after vehicles are ordered face an expensive and entirely avoidable gap between delivery and operability.
Engage your utility on three fronts early: current service capacity at your depot, the timeline and cost of any upgrades required, and the availability of time-of-use rate structures.
Time-of-use pricing is not a minor lever. Department of Energy guidance notes that electric vehicle supply equipment (EVSE) loads create significant demand charges, and that scheduling charging during off-peak hours is one of the few cost levers a fleet manager controls directly.
Deciding where chargers go requires the same telematics and utilization data you used to screen candidates. The Town of Apex, which centralizes its fleet data in Fleetio, ran into exactly this. Planning charging infrastructure meant analyzing a dataset large enough to crash the town's earlier systems. Blue Arrow, Apex's local Geotab partner, processed the report and delivered the charging hotspots the town used to design its layout.
On ratios, DOE research confirms that battery-electric vehicle to EVSE port ratios of two or higher are viable in depot contexts, provided dwell times are long and managed charging staggers load across the overnight window. Right-sizing charger count against actual dwell data prevents over-investment in hardware while preserving flexibility as the fleet grows.
Workforce Training and Phased Rollout Keep the Transition From Stalling
Technician training and facility upgrades are where transitions most often stall after procurement is settled, because neither gets planning attention proportional to its operational impact.
EV maintenance requires a different skill set than diesel repair: high-voltage safety certification, battery diagnostic procedures and familiarity with regenerative braking and thermal management systems. The Federal Transit Administration's Zero-Emission Fleet Transition Plan guidance treats skill gaps, training needs and retraining requirements as formal plan components, alongside documented utility partnership structures. Treating them as administrative formalities raises the risk of maintenance delays and technician injuries once assets are in service.
Facility readiness involves more than adding chargers. Shop electrical panels may need upgrading to handle EVSE loads. Personal protective equipment and insulated tool inventories need updating. Service bay layouts may need adjustment to accommodate high-voltage lockout and tagout procedures.
A phased rollout manages both the learning curve and the operational unknowns. A small pilot cohort on a constrained set of routes generates real data on range performance, charging behavior and maintenance patterns under your specific conditions. That data either validates your TCO model or surfaces the assumptions that need revising before you scale. Committing to a larger deployment before completing a pilot cycle trades the cost of fixing a wrong assumption later against the modest delay of proving the model first.
Most Transition Plans Go Silent Once the Mixed-Energy Fleet Begins
On day one of mixed-fleet operations, a manager is suddenly tracking two cost streams and two refueling workflows, each with its own maintenance playbook attached. This phase lasts years, and most EV transition guides end before it starts.
Fuel transactions, charging sessions, oil changes and battery diagnostic work orders have to live in the same system to produce an accurate cost picture per asset. Tracked separately, replacement and deployment decisions get made on an incomplete view of what each unit actually costs.
Splend runs nearly 1,700 Kia Sportage and Toyota Camry hybrids for rideshare drivers across Australia, connecting telematics and CRM data through API integrations so every vehicle's status lives in one place. The same architecture carries over the moment EV and ICE assets share a roster.
| Capability | ICE asset application | EV asset application |
|---|---|---|
| Cost tracking | Fuel entries logged by date, vendor and volume | Charging events recorded by session, cost and kilowatt-hours delivered |
| Maintenance scheduling | PM intervals set by mileage or engine hours | PM intervals set by OEM EV-specific schedules, including battery health checks |
| Field inspections | DVIRs completed via mobile app covering standard defect categories | DVIRs adapted to EV components, including charging port condition and high-voltage warnings |
| TCO reporting | Fuel, parts, labor and downtime costs tied to individual assets | Energy, parts, labor and downtime costs tied to individual assets in the same view |
| Utilization tracking | Assignment, mileage and idle data per asset per period | Assignment, mileage and state-of-charge data per asset per period |
Fleetio's fuel history page and EV Charge Tracking place both cost streams in one TCO view per asset, so a manager looking at a mixed roster sees both energy types in the same report. State-of-charge data adds range monitoring to that view, giving a live signal on each EV's energy level alongside its charging history. One view means replacement decisions get made with confidence instead of by reconciling two exports every time a question comes up.
If you are heading into this phase now, our guide to managing a fleet of both EV and ICE assets covers the day-to-day workflows in more detail.
Let Fleet-Wide Data Shape Every Replacement Cycle After the First
After the first EVs have run for a full year, the centralized view you built at the start becomes something more useful. It becomes a live comparison between ICE and electric assets on cost per mile, maintenance frequency, downtime rate and utilization, all measured against each other in the same platform.
An asset approaching end of life does not automatically become an EV candidate. Each replacement decision depends on three current inputs.
- Telematics data showing whether the route profile still fits EV parameters
- Updated infrastructure costs based on what your depot expansion actually cost per port
- The purchase price environment for that specific asset class today
Some cycles will favor EVs. Others will favor extending an ICE asset's life while infrastructure matures or purchase costs fall in a particular segment. The data tells you which applies to each individual unit.
Ozark Regional Transit's cost-per-mile framework demonstrates this well. Because the team tracks lifecycle costs at the asset level on an ongoing basis, every replacement conversation begins with a specific cost history rather than a general argument. That is the difference between electrification as a one-time procurement initiative and electrification as a continuous fleet composition strategy, updated as conditions change.
The Plan Does Not Stop at Deployment
Operational data is the clearest guide to the fleet you are building, but only if you can read it. When fuel costs, charging events, maintenance histories and utilization records all live in one place, the manager weighing the next replacement sees cost per mile for every asset with EV and ICE side by side, PM schedules and work order history attached to each unit.
That is the whole plan, really. Not a target date or a percentage of the roster electrified, but a record complete enough that each decision in the long middle is made on evidence rather than instinct.
Run both energy types from one record
See how Fleetio centralizes mixed-energy fleet data into a single source of truth, from fuel receipts to charging sessions.
Request a demo

Senior Copywriter
Tyler Freeland is a Senior Copywriter at Fleetio. A former creative writer for Freightliner and Western Star, he now transforms complex (and sometimes common) fleet management topics into practical, engaging insights that fleet professionals can apply every day.
LinkedIn|View articles by Tyler FreelandReady to get started?
Join thousands of satisfied customers using Fleetio
Questions? Call us at 1-800-975-5304