2025 Fleet Cost per Mile & TCO: Utility Fleets
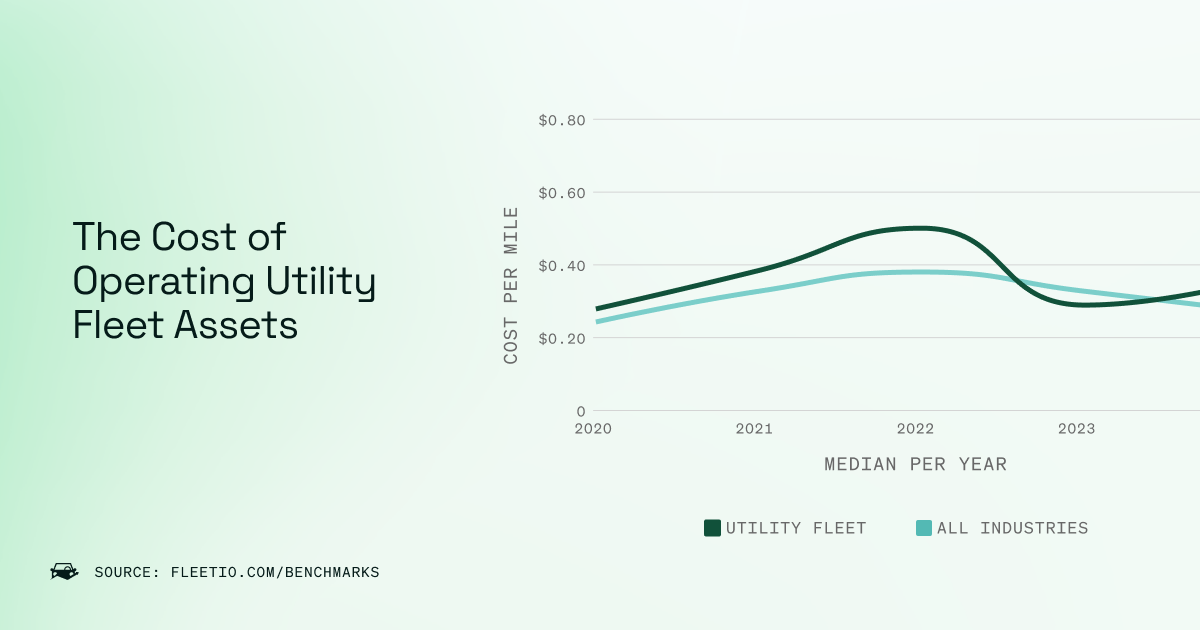
Utility fleets cost $0.29 per mile to operate in 2025 — one of the highest across industries. Fewer miles doesn’t mean lower costs. Idle time, complex vehicles, and unpredictable usage make TCO harder to control without the right data.
Apr 1, 2025
3 min read
Benchmark Snapshot: 2025 at a Glance
According to Fleetio’s 2025 Fleet Benchmark Report:
| Metric | Utility Fleets | Overall Fleet Average |
|---|---|---|
| Miles Driven | 12,775 | 33,368 |
| Cost per Mile (CPM) | $0.29 | $0.24 |
| Fuel CPM | $0.17 | $0.14 |
| Service CPM | $0.09 | $0.07 |
| Total Cost per Asset | $13,267.22 | $10,168.71 |
Utility fleets drive fewer miles than average, yet carry one of the highest CPMs and TCOs. Between idle time, off-hours work, and specialized equipment, these vehicles operate under pressure — and every dollar needs to be tracked.
Compare your fleet to the benchmark
Use our 2025 Fleet Benchmark Report to see how your utility fleet compares to others in the field. Spot inefficiencies, justify new investments, and plan smarter.
Download now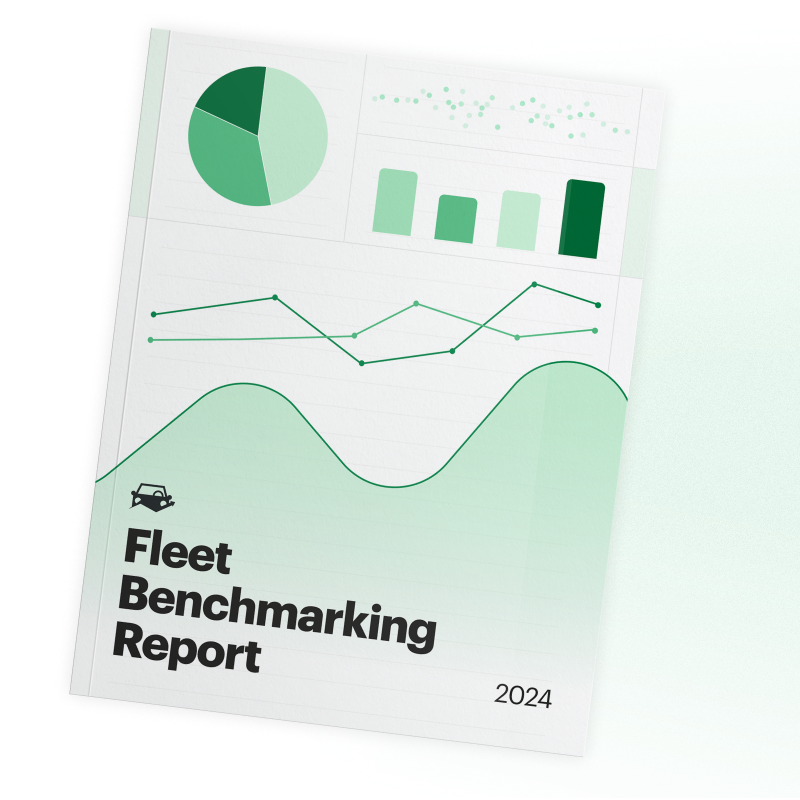
What’s the Total Cost of Ownership for Utility Fleets?
The median total cost of ownership (TCO) for a utility fleet asset in 2025 is $13,267.22, about 30% higher than the fleet-wide average of $10,168.71.
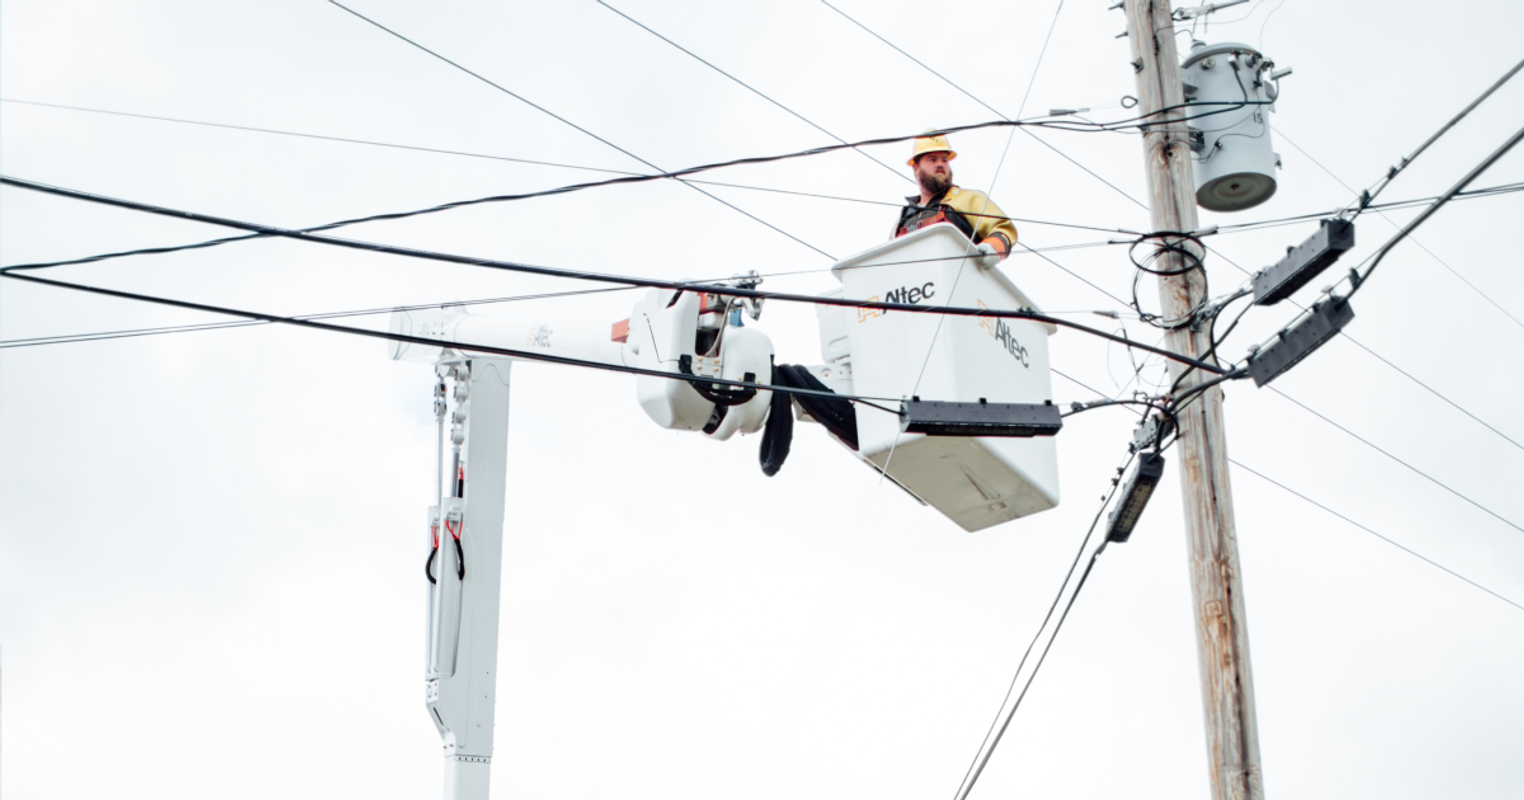
Utility vehicles may drive less, but they’re built for complexity — outfitted with lifts, booms, and generators that require maintenance beyond oil changes. Emergency callouts, long idle times, and regulatory demands only add to the cost.
To reduce TCO, utility fleets should:
- Monitor cost by asset class (light-duty vs. upfit vehicles)
- Improve PM compliance, especially for specialty equipment
- Use historical cost data to guide smarter replacements
TCO tells the real story — not just how much you're spending, but how wisely.
Why Is Utility Fleet CPM Higher Than Average?
Utility fleets have a job to do — and that job often comes with built-in costs. From powerline repairs to water main emergencies, these assets run when others rest. That means:
- Long idle times
- Low-speed, high-demand usage
- Heavier vehicle classes with upfits
- Higher compliance and safety standards
These conditions are part of the job. But they don’t have to drive your costs through the roof.
What’s Driving Up Your CPM or TCO?
If your CPM is above $0.29 or your TCO continues to climb, there’s likely a disconnect in maintenance, utilization, or cost visibility. Common culprits include:
- Inconsistent PM across mixed asset types
- Aging vehicles still in active rotation
- Limited insight into repair vs. replacement decisions
Fleetio helps utility fleets connect the dots between inspections, cost tracking, and asset performance — so you can reduce surprises and keep essential vehicles mission-ready.
How to Lower Your Fleet’s Cost per Mile and TCO
With fleet software for utilities, you can:
- Tie maintenance activity to real CPM and TCO data
- Automate inspections and service across mixed fleets
- Report on cost trends by asset class, department, or region
- Plan replacements with confidence using historical benchmarks
Pro-tip
Utility fleets that track maintenance cost by asset type see up to a 22% drop in reactive repairs. Aligning your PM strategy with your fleet composition helps reduce downtime and budget surprises.
Keep Learning
Ready to improve your utility fleet’s performance?
Fleetio empowers utility fleets to reduce downtime, track costs by asset type, and build smarter PM programs — all in one easy-to-use platform.
See how it works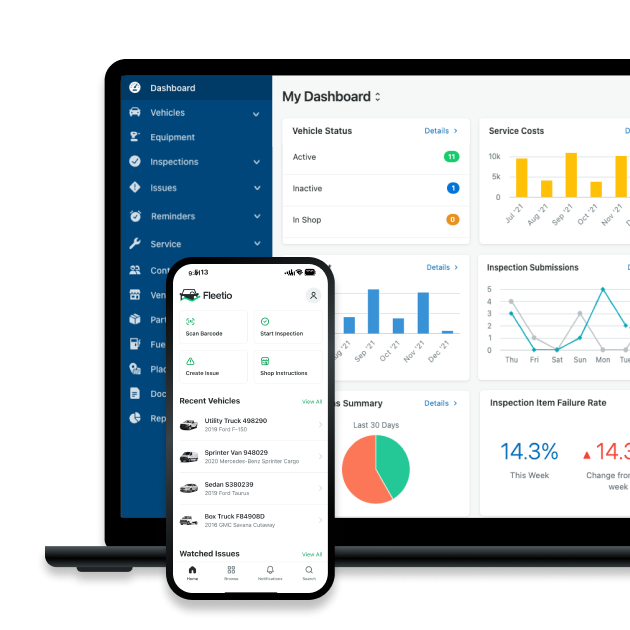

Director of Fleet Content, Fleetio
Zach Searcy is the Director of Content at Fleetio with more than 5 years of experience in the automotive and fleet industries. His content creation days started in middle school when he and his friends began filming lightsaber battles to upload to a new website: 'YouTube.'
LinkedIn|View articles by Zach SearcyReady to get started?
Join thousands of satisfied customers using Fleetio
Questions? Call us at 1-800-975-5304