How Much Gas Do You Burn Idling (and What Does It Cost)?
Most passenger assets burn between 0.16 and 0.39 gallons of fuel per hour while idling. Commercial assets burn more, generally 0.49 to 0.97 gallons per hour. Where a given asset lands depends on engine size, fuel type and what else is running while the engine turns.
Dec 13, 2023 | Updated: Oct 2, 2026
21 min read
What you need to know
- Passenger assets burn roughly 0.16 to 0.39 gallons per hour at idle. Commercial assets burn 0.49 to 0.97. Engine displacement accounts for most of that spread, which is why a compact sedan and a three-quarter-ton work truck should never be held to the same idle benchmark.
- A Class 8 truck that idles overnight burns 1,000 to 1,800 gallons a year. At $4 per gallon, NACFE puts the waste at $4,000 to $6,000 per truck annually.
- Fifteen minutes of daily idling costs about $130 per asset per year. The same habit across 50 assets costs roughly $6,500, which is why idle reduction barely registers on one unit and pays at fleet scale.
- Idle hours accumulate without mileage. An asset judged only by its odometer looks healthier than it is, and mileage-based service intervals drift later than actual engine run time justifies.
- Past roughly 10 to 30 seconds, restarting uses less fuel than idling. Fuel injection and engine control units retired the old "starting burns five minutes of fuel" rule decades ago.
Most passenger assets burn between 0.16 and 0.39 gallons of fuel per hour while idling. Commercial assets burn more, generally 0.49 to 0.97 gallons per hour, and NACFE puts a typical Class 8 truck at around 0.8 gallons per hour. Where a specific asset lands depends on engine size, fuel type and what else is drawing power while the engine turns.
Those figures look harmless in isolation. A driver who leaves the engine running for ten minutes outside a job site has burned about a tenth of a gallon, which nobody notices on a fuel card statement.
Repetition is what makes it expensive. Argonne National Laboratory estimates that US passenger assets, light trucks, medium-duty trucks and heavy-duty assets together consume more than 6 billion gallons of fuel per year without moving. A single long-haul truck that idles through driver rest periods accounts for 1,000 to 1,800 gallons of that, which NACFE prices at $4,000 to $6,000 per year per asset at $4 diesel.
In a fleet, the same behavior repeats across every unit on the yard, and that is what turns a rounding error into a line item on your fleet operating costs.
What Affects How Much Fuel an Asset Burns While Idling
The range above is wide for a reason. Two assets sitting in the same lot with their engines running can burn fuel at rates that differ by a factor of five. Knowing which variable is doing the work tells you whether an asset's fuel numbers deserve attention or just reflect what it was built to do.
Engine size changes idle fuel use
An idling engine is still pumping air, moving oil and overcoming its own internal friction. Larger engines have more mass in motion and more displacement to fill, so they need more fuel to keep turning even with the asset stationary.
Department of Energy measurements of idle fuel consumption across gasoline and diesel assets show the pattern cleanly. A compact 2.0 liter sedan sits at the bottom of the range. A large-displacement sedan roughly doubles it. Medium and heavy trucks with 6 to 10 liter diesels climb higher still, and an asset running power takeoff equipment can exceed a gallon per hour because the engine is doing real work while parked.
The practical consequence is that displacement, not driver discipline, explains most of the gap between a compact service car and a dump truck. Comparing their fuel-per-hour figures side by side without that context produces a conclusion about the wrong thing.
Diesel and gasoline engines behave differently
Diesel assets usually post higher idle burn than gasoline assets, though the fuel itself is only part of the explanation. Diesels dominate the heavy end of most fleets, so they carry bigger displacements, heavier accessory loads and higher idle speeds under load.
Engine design contributes as well. Compression ratios, injection strategy and the idle speed the engine control unit targets all shift how much fuel an engine needs to stay running. A small diesel sedan and a small gasoline sedan land within a few hundredths of a gallon per hour of each other.
Asset class is the better predictor. If you are trying to anticipate idle fuel burn, the question to ask is what the asset does and how big its engine is, not which pump it visits.
Asset systems and conditions influence fuel use
Every system drawing power while the engine idles raises consumption. Climate control is the largest of these in most assets. Charging systems, onboard electronics, lift gates, hydraulics and auxiliary equipment each add load the engine has to answer with more fuel.
Cold weather deserves separate attention because it changes both the rate and the duration of idling. A cold engine runs richer until it reaches operating temperature, so the gallons-per-hour figure starts high and settles. Duration is the bigger factor: operators leave assets running to keep cabs warm, clear windshields and avoid cold restarts, which means winter idle sessions stretch from minutes into tens of minutes. Extreme heat produces a similar pattern through air conditioning demand.
The result is that an asset with consistent routes and consistent driver behavior can still show meaningfully different fuel numbers in January than in May. Comparing an asset's winter fuel records against its summer baseline, or against a mild-climate asset doing identical work, will flag a problem that does not exist. Seasonal comparison windows matter when you are looking at fluctuating fuel costs.

Pro-tip
Before comparing fuel consumption across assets, group them by engine size and duty type. An idle benchmark that lumps service vans in with vocational trucks will make the trucks look wasteful and let genuinely inefficient vans go unnoticed.
How Much Does Idling Cost Over Time?
Gallons per hour is the wrong unit for a budget conversation. What a fleet manager needs is annual dollars, and getting there takes two pieces of information: how long assets idle and what you pay per gallon.
Small daily idle periods create annual fuel costs
Start with one asset and one habit. Fifteen minutes of idling per day is unremarkable, the kind of number nobody would flag in a daily report.
Single-asset idle cost
Average minutes idling per day × gallons burned per minute × working days per year × price per gallon
Run it for a work truck burning 0.5 gallons per hour, which is 0.0083 gallons per minute. Fifteen minutes a day comes to 0.125 gallons. Across 260 working days that is 32.5 gallons, or about $130 at $4 per gallon.
One hundred and thirty dollars will not get anyone's attention, and that is precisely why idling persists. The cost is real, measurable and individually too small to act on.
Fleet-wide idle time multiplies operating expenses
The arithmetic changes when you apply the same habit across a roster.
Fleet-wide idle cost
Number of assets × average minutes idling per day × gallons burned per minute × working days per year × price per gallon
Here is 15 minutes of daily idling across 260 working days at $4 per gallon, at the idle rates from the ranges above.
| Idle rate | Example asset | One asset per year | 50 assets per year |
|---|---|---|---|
| 0.16 gal/hr | Compact gasoline sedan | 10 gallons / $42 | 520 gallons / $2,080 |
| 0.39 gal/hr | Large gasoline sedan | 25 gallons / $101 | 1,268 gallons / $5,070 |
| 0.49 gal/hr | Light commercial asset | 32 gallons / $127 | 1,593 gallons / $6,370 |
| 0.80 gal/hr | Class 8 truck | 52 gallons / $208 | 2,600 gallons / $10,400 |
| 0.97 gal/hr | Asset running PTO equipment | 63 gallons / $252 | 3,153 gallons / $12,610 |
The operational point is not that the totals are large. It is that the lever is small. Cutting average idle time from 15 minutes to 10 across 50 commercial assets saves roughly a third of those gallons, and five minutes per driver per day is a target a dispatcher can actually hit. Per-asset reductions too small to measure individually are the ones that compound into real numbers at scale, which is why idle time belongs among the optimization metrics worth tracking.
Fuel prices make idle costs harder to ignore
Idle burn is fixed by the engine. The cost of it is set by the market. Every table above recalculates upward when diesel climbs, without a single driver changing behavior.
That is an uncomfortable feature of idle waste: it is the one fuel expense that generates no productive output, so it absorbs price increases while delivering nothing in return. Fleets that reduce idle time during cheap-fuel periods are buying insulation against expensive ones, and fleets that have never measured it are exposed by exactly the amount they have never quantified.
Idling: the silent cost killer
Get the data-backed playbook for cutting fuel expenses and improving efficiency across your fleet.
Grab it today
Is It Better to Idle or Restart the Engine?
This is the question that decides whether an idle policy survives contact with drivers. The belief that starting an engine burns five minutes' worth of fuel is widespread, durable and no longer true.
Modern engines restart efficiently
The five-minute rule came from carbureted engines, which needed an enriched fuel charge to catch and stay running. Electronic fuel injection replaced that with metered delivery, and the engine control unit now calculates exactly what a start requires based on coolant temperature, air temperature and crank position.
The practical threshold most sources land on is 10 to 30 seconds. Past that, restarting consumes less fuel than continuing to idle. Below it, the difference is small enough that either choice is defensible.
Idle speed control is a live area of engineering research for this reason, because fuel burned at idle is a meaningful share of total consumption. One study in the Ain Shams Engineering Journal notes that roughly 30% of fuel consumption in city driving occurs during idling, and demonstrates measurable fuel savings from better idle speed control alone. Engines have been getting better at idling efficiently. They have not gotten good enough to make idling free.
When idling may still be operationally necessary
Some idle time is the job. Treating it as waste produces policies drivers quietly ignore, which is worse than having no policy.
- Brief traffic and queue stops. A delivery asset in stop-and-go traffic or waiting at a gate is below any sensible shutdown threshold, and cycling the engine repeatedly adds starter and battery wear without saving fuel.
- Active worksite pauses. Assets powering hydraulics, lifts, compressors or PTO equipment are consuming fuel to do work. This shows up in fuel records as idle burn, but the engine is loaded and productive.
- Extreme weather. Below freezing and in high heat, cab climate control is a safety and retention issue. Drivers on required rest in an unheated cab is not a fuel decision.
A defensible policy names these conditions explicitly and sets expectations for everything else. That is a narrower target than "reduce idling," and a far easier one to enforce.
Why Excessive Idling Creates More Than Fuel Waste
Fuel is the visible cost. The less visible ones land on the asset itself and on the numbers you use to evaluate it.
Idling contributes to engine wear
An idling engine accumulates operating hours. It does not accumulate miles. For any fleet that schedules service and projects remaining life on mileage, this is a measurement gap rather than a mechanical one.
Consider two identical trucks, each with 60,000 miles. One spent 400 hours idling over that period and the other spent 40. On paper they are the same asset at the same point in its life. In practice one engine has run roughly ten additional work weeks, and its oil, bearings and seals know it even though the odometer does not.
The fix is to know which assets carry idle-heavy duty cycles and account for engine hours alongside mileage when planning service and replacement. Assets that sit running get older faster than their odometers suggest.
Long idle periods can affect maintenance needs
Extended idling runs an engine at low load and lower combustion temperature than it was designed for. Over time that contributes to faster oil contamination and, in diesels with aftertreatment systems, more frequent regeneration cycles.
None of this breaks an engine next week. It shifts service needs earlier than the maintenance plan anticipates, which means idle-heavy assets drift toward deferred maintenance without anyone deciding to defer anything. Building idle exposure into preventive maintenance intervals for those assets keeps the schedule aligned with how the engine is actually being used.
Idle-heavy operation lowers overall efficiency
The cleanest way to understand excessive idling is as a utilization problem. Fuel and engine hours are being consumed while the asset produces nothing, which distorts every per-mile metric a fleet manager relies on.
An asset with high idle time posts elevated cost per mile and depressed miles per gallon while performing its assigned work correctly. Read as an efficiency number, that looks like a maintenance problem or a driver problem. Read as a utilization number, it is closer to the truth: the asset is spending a large share of its operating cost on non-productive time.
That distinction determines what you do next. Efficiency problems get sent to the shop. Utilization problems get sent to dispatch.
What Idle Time Can Reveal About Fleet Operations
Treated as a symptom rather than a behavior, idle time is one of the more informative numbers a fleet collects. It tends to concentrate wherever the operation is waiting on something.
Repeated idling may signal scheduling inefficiencies
Idle time clusters around delay. Drivers idle at loading docks, in gate queues, at job sites that are not ready and between appointments that were scheduled too far apart.
A utility contractor finding that three crews consistently post 45 minutes of idle time between 7:00 and 8:00 a.m. has not found a driver problem. Those crews are arriving before the site is ready, which is a dispatch window set an hour too early. The fuel is the receipt for a scheduling decision made somewhere upstream.
This is why idle time is worth reviewing by location, time of day and job type before it is reviewed by driver. Patterns that repeat across multiple operators are almost always structural.
Driver habits influence fuel outcomes
Some idle time genuinely comes down to habit. Leaving the engine running during paperwork, meals or extended phone calls is a choice, and it varies considerably between operators doing identical work.
The useful response is a conversation rather than a citation. An operator looking at their own fuel records next to a peer's, doing the same route in the same asset class, generally reaches the right conclusion without being told. Drivers who have never seen the numbers have no reason to think their habits are unusual.
Visibility into patterns is what makes that conversation possible and keeps it from becoming adversarial. Coaching built on a quarter of fuel records holds up. Coaching built on one bad week does not.
Asset usage patterns affect idle exposure
Some assets idle more because of what they are assigned to do. A bucket truck on utility work, a refuse asset on a dense residential route and a long-haul tractor with sleeper berth time all carry structurally higher idle exposure than a sales fleet sedan.
Ranking assets by fuel consumption without that context produces a list of your most heavily utilized specialty equipment and calls it a problem. The comparison only means something within a role: this bucket truck against other bucket trucks, this route against comparable routes.
Role-aware comparison is slower to set up and the only version that supports a decision. Raw fuel data ranked across an entire mixed fleet reliably points at the wrong assets.
Fuel costs running wild? Log 'em up!
This easy-to-use template helps you track, measure and manage every dollar at the pump.
Get your hands on it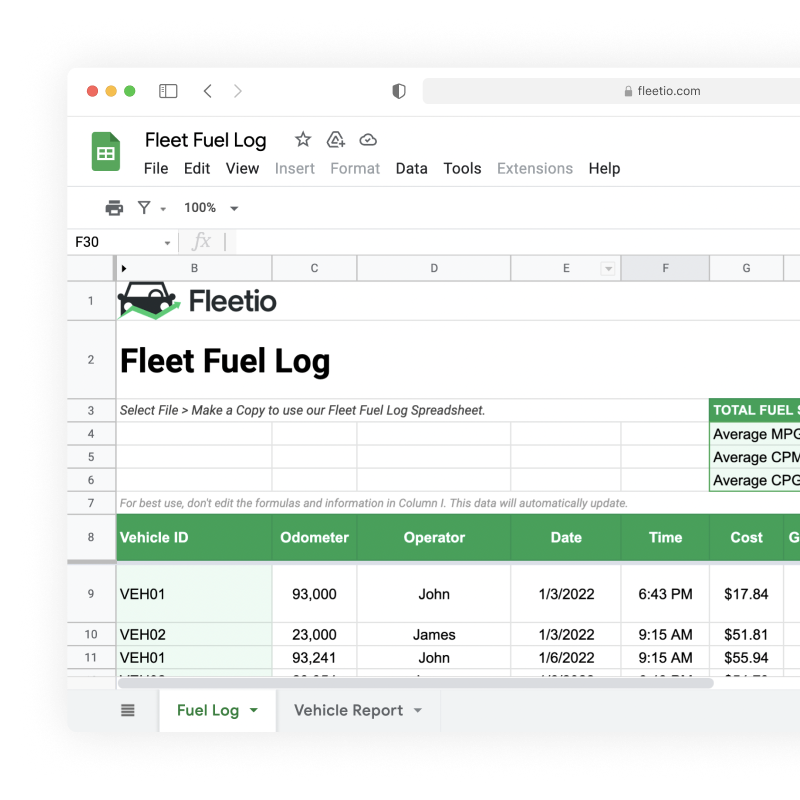
Practical Ways Fleets Can Reduce Unnecessary Idling
NACFE's baseline recommendations for idle reduction are consistent across fleet types: set a policy, train and incentivize drivers, provide alternatives for driver comfort during downtime and monitor results. The details of how you do that are where fleets differ.
Create realistic idle reduction policies
A policy that reads "no idling over two minutes" will be ignored by the first driver who faces a 20 degree morning, and once one rule is ignored the rest lose authority.
Write the exceptions into the policy instead. Name a temperature threshold below which cab heat is permitted. State that PTO and worksite operation is excluded. Distinguish between a queue stop and a parked asset. What remains is a rule that covers the discretionary idling you actually want to reduce.
Then make the reasoning available. Drivers who understand that 15 minutes a day across the fleet costs several thousand dollars a year tend to accept the policy. Drivers handed a number with no explanation treat it as arbitrary, because from where they sit it is.
Improve job and route coordination
A meaningful share of idle time is created by the schedule rather than the driver. Staggering dispatch times so crews do not arrive at sites simultaneously, tightening appointment windows so assets wait less and sequencing routes to cut dwell time between stops all reduce idling without asking anyone to change a habit.
Confirming site readiness before dispatch is often the highest-yield change available. An asset that arrives 40 minutes early idles for 40 minutes, and no amount of driver coaching fixes a dispatch window set against a site that is not open.
Planning changes also tend to stick in a way behavioral changes do not. A revised dispatch window keeps working after the training session is forgotten.
Use maintenance planning to support fuel efficiency
Engine condition sets the floor on fuel efficiency at every operating point. Fouled injectors, a restricted air filter, degraded oil or a failing sensor raise consumption whether the asset is moving or standing still.
This is the part of fuel efficiency that gets managed as a separate concern and should not be. An asset with deferred service burns more fuel on the road and more at idle, so maintenance compliance and fuel performance move together. Fleets chasing idle reduction while carrying a backlog of overdue PMs are working on the smaller of two problems.
Using Fleet Data to Better Understand Idle-Related Costs
All of this depends on records good enough to support a conclusion. Fuel receipts in one system, service history in another and asset assignments in a spreadsheet make it difficult to tell an idling problem from a mechanical one or a route-design one.
Fuel records help identify long-term cost trends
Centralized fuel records make consumption patterns visible over months rather than fill-ups. Fleetio consolidates fuel entries, fuel card transactions and meter readings against each asset, which turns scattered receipts into a per-asset consumption history you can actually read.
What that history shows is which assets consistently cost more to run than comparable units doing comparable work. An asset burning noticeably more fuel per mile than its peers is a candidate for investigation, and idling is one of several explanations worth checking alongside mechanical condition, fuel overage and route profile.
This is trend analysis, not live monitoring. Fleetio does not track idle time directly or watch fuel burn in real time. It gives you the record that makes a pattern visible once it has formed, which is the level most cost decisions get made at anyway.
Maintenance history supports efficiency planning
Fuel trends raise questions that service history helps answer. When an asset's fuel costs climb, the service record is where you find out whether a PM was deferred, whether a fuel system repair preceded the change or whether the engine has an open issue that could explain it.
Keeping both records against the same asset is what makes that check quick. Fleetio holds fuel history and maintenance history together per asset, so reviewing one against the other does not require reconciling two systems.
The connection still requires a person to make it. Fleetio surfaces the data; it does not diagnose the cause. What it changes is how long the investigation takes and whether you have the records to complete it.
Asset reporting improves accountability
Comparing assets is where fuel data becomes a decision. Fleetio's dashboards and reports cover cost per mile, asset-level expense tracking and fuel economy trends, which lets you rank assets within a class and see which ones consistently fall outside the group.
That ranking is a starting point for a conversation with a supervisor, a dispatcher or a shop, not an answer. An asset at the top of a cost-per-mile list might be idling excessively, due for service, assigned to a punishing route or simply working harder than the rest.
The value is in narrowing the field. Informed decisions about where to look next are what asset-level reporting is for, and they beat the alternative of reviewing an entire fleet or guessing.
Small Idle Habits Create Big Fuel Costs
Idling burns more fuel than most operators assume and less than any single incident would justify worrying about. That combination is what makes it persistent. Fifteen minutes a day costs $130 on one asset and $6,500 across 50, and nobody experiences the $6,500 version directly.
The fleets that reduce it are the ones that can see it. Centralized fuel records, service history and asset-level cost reporting turn idle waste from a suspicion into a number, and a number is something you can set a target against. Engine hours alongside mileage, fuel economy compared within asset classes and dispatch patterns reviewed by location will tell you where your idle time actually lives.
See what your fuel data is telling you
Fuel records, maintenance history and asset-level cost reporting in one system, so you can spot the assets that cost more to run and find out why. See what that looks like for your fleet.
Explore fuel management
FAQs
Does idling use more fuel than driving slowly?
Per hour, no. Per mile, idling is infinitely worse, because the asset covers no distance. An asset burning 0.5 gallons per hour at idle produces zero miles for that fuel, while the same asset moving at 15 mph through a job site covers 15 miles on a similar or slightly higher burn. This is why idle time damages cost-per-mile and miles-per-gallon figures so sharply: the fuel appears in the numerator with nothing to show in the denominator.
Does cold weather increase idle fuel consumption?
Yes, through two separate mechanisms. A cold engine runs a richer mixture until it reaches operating temperature, so the burn rate itself starts higher than a warm idle. The larger effect is duration, since operators leave assets running for cab heat, defrosting and to avoid cold restarts, which stretches typical idle sessions well beyond what mild weather produces. Both factors mean winter fuel records should be compared against the previous winter rather than against the summer baseline. See the section on asset systems and conditions for more detail.
How much fuel can a fleet save by reducing idle time?
It depends on the starting point and the asset mix, so the honest answer is to calculate it from your own numbers using the formulas above. For scale, NACFE reports that a fleet investing in idle-reduction technology can save around 1,800 gallons of fuel per truck per year on long-haul assets that currently idle overnight. For lighter commercial fleets, trimming five minutes of daily idling across 50 assets at 0.49 gallons per hour saves roughly 530 gallons a year. The figure that matters is your current average idle time, which most fleets have never measured.
Does idle time affect preventive maintenance schedules?
It should. Idling accumulates engine hours without accumulating mileage, so assets on mileage-only PM intervals reach their actual service needs before their scheduled ones. Extended low-load running also contributes to faster oil contamination and, in diesels with aftertreatment, more frequent regeneration cycles. Fleets with idle-heavy duty cycles generally benefit from engine-hour-based intervals on those assets, or from shortened mileage intervals that account for the extra run time.
Why do fleet managers monitor idle-related fuel trends?
Because idle fuel waste is invisible in every individual instance and material in aggregate. Monitoring fuel trends at the asset level surfaces units that consistently cost more to operate than comparable assets, which is the signal worth investigating. It also distinguishes between the three plausible causes, since a cost increase traced to a deferred PM, a route change or an operator habit calls for three different responses. The point of the trend data is to narrow the question before anyone spends time on the answer.

Fleet Content Specialist
Through interviews, blog posts and webinars, Alex covers the tactics and technologies exceptional fleet managers use to achieve results. By sharing their success stories, his work aims to inform and inspire fleet professionals of all stripes.
LinkedIn|View articles by Alex Borg
Senior Copywriter
Tyler Freeland is a Senior Copywriter at Fleetio. A former creative writer for Freightliner and Western Star, he now transforms complex (and sometimes common) fleet management topics into practical, engaging insights that fleet professionals can apply every day.
LinkedIn|View articles by Tyler FreelandReady to get started?
Join thousands of satisfied customers using Fleetio
Questions? Call us at 1-800-975-5304