Fleet Management Costs & How to Control Them
Fleet costs sit in fuel cards, shop invoices, paper inspections and finance spreadsheets that never meet. Here is what actually drives fleet management costs, where they hide and how to build measurement that holds up in front of leadership.
Aug 10, 2023 | Updated: Sep 10, 2026
21 min read
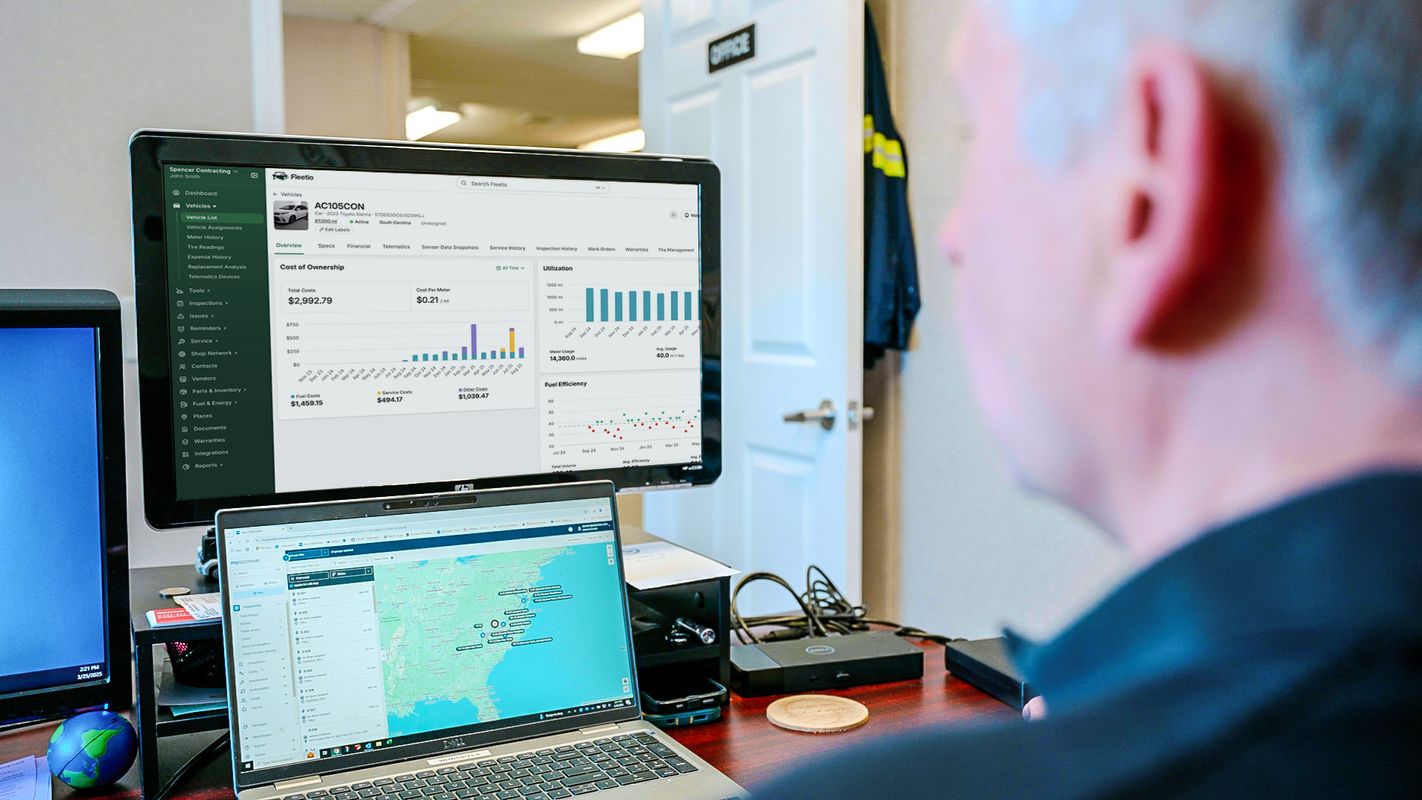
What you need to know
- Fleet costs feel high because they are fragmented. Fuel cards, shop invoices, inspection forms and accounting ledgers each hold a piece of the picture. Until those pieces sit in one place, every budget conversation starts with a guess.
- The most expensive costs never generate an invoice. Downtime, admin reconciliation, overservicing and underused assets drain budgets quietly because nothing bills you for them.
- Two metrics carry the weight. Total cost of ownership and cost per mile. Fleetio benchmark data puts the overall fleet average at $0.24 per mile across 33,368 miles driven annually, with trucking and logistics fleets running $0.31.
- Fleet size changes the math more than most managers expect. ATRI found truckload fleets with fewer than five trucks spent $0.275 per mile on repair and maintenance, against $0.169 for fleets above 1,000 trucks.
- Prevention and automation move the number. Preventive schedules, digital inspections, line-item repair approvals and automated data capture reduce spend without degrading service.
Ask ten fleet managers what their fleet costs to run and you will get ten confident answers backed by nine different systems. Fuel spend lives with the card provider. Repair history sits in a shop's invoicing software or a filing cabinet. Inspection results are on paper. Depreciation is a line in a finance spreadsheet nobody in operations sees.
That fragmentation is why fleet management costs feel uncontrollable. The money is going somewhere specific, on a specific asset, for a specific reason. Without one record tying spend to assets, budget season becomes an argument about estimates.
The stakes climb as fleets scale. Budget pressure arrives alongside uptime expectations that leave no room for surprise breakdowns. Compliance exposure grows with every asset added. Operational complexity multiplies faster than headcount.
This guide covers what fleet management costs actually include, which drivers deserve your attention, where costs hide and how to build a measurement practice that holds up in front of finance.
What are fleet management costs?
Fleet management costs represent the total financial impact of owning, operating, maintaining and managing your assets across their useful life. That covers the obvious line items and the ones that never produce a bill.
There is no single fleet cost number. What you have is a set of cost types that behave differently, fluctuate for different reasons and respond to different controls. Treating them as one lump sum is how fleets end up cutting the wrong thing.
Fixed fleet management costs
Fixed costs stay roughly constant regardless of how hard you run an asset:
- Depreciation
- Lease or loan payments
- Insurance premiums
- Taxes, registrations and permits
- Licensing and compliance fees
These get set once and rarely revisited. A policy renews, a lease rolls over, an asset depreciates on a schedule established years ago. Because they arrive predictably, they escape scrutiny even after the conditions that justified them have changed. An asset sitting at 30% utilization still carries full insurance and full depreciation.
Poor visibility makes that hard to catch. If you cannot see what an asset delivers against what it costs to hold, you have no basis for questioning whether the fixed spend is still justified.
Opportunity cost belongs in this conversation too, and it almost never gets counted. Capital tied up in spare or backup vehicles is capital committed elsewhere. Three trucks held in reserve for a peak that arrives twice a year represent real money parked in a yard.
Variable and semi-variable fleet management costs
Variable costs move with usage, driver behavior and maintenance strategy. They include fuel, tires, corrective repairs, parts, fluids, tolls, outsourced labor and technician hours tied to activity.
Semi-variable costs sit in between. Maintenance is the clearest example. A preventive schedule generates a predictable baseline while usage-driven repairs stack on top of it, and the ratio between the two says a lot about how well the program works.
Variable costs carry the most volatility, which also makes them the biggest savings opportunity. Fuel prices and parts pricing move outside your control. Idle time, route efficiency, overfills, service intervals and shop selection do not. Operational control is where the savings live.
Direct vs. indirect fleet costs
Direct costs attach to a specific asset and generate a receipt. Fuel, a brake job, a set of tires, a registration renewal.
Indirect costs attach to the operation and generate nothing. A truck down for three days means a crew standing around, a route reassigned, a customer rescheduled and a manager spending an afternoon on the phone. A missed inspection becomes a citation months later. Administrative hours spent reconciling receipts are payroll spent on data entry.
Leadership blind spots form here. Finance reviews what appears on invoices. Indirect costs never appear on invoices, which is exactly why they grow unchecked.
| Cost type | Examples | Why it gets missed |
|---|---|---|
| Fixed | Depreciation, insurance, lease payments, registration | Predictable, so rarely re-examined |
| Variable | Fuel, tires, corrective repairs, tolls, outsourced labor | Scattered across vendors and systems |
| Semi-variable | Preventive maintenance, in-house technician labor | Split between schedule and usage |
| Indirect | Downtime, admin time, compliance fallout | No invoice ever arrives |
Why fleet management costs matter
Cost data shapes how the rest of the company sees your operation. A fleet that can explain its spend at the asset level gets treated as a managed function. A fleet that cannot gets treated as overhead. The difference shows up in budgets, in capital approvals and in how much autonomy the team gets.
Fleet costs are harder to see than most leaders realize
Cost data lives in silos by default. Fuel transactions sit with the card provider. Repair records sit with each shop. Inspection results sit on paper or in a separate app. Parts inventory sits in a spreadsheet. Accounting sees totals with no asset-level detail.
Each silo is defensible on its own. Together they guarantee that nobody can answer a question as basic as what one truck cost to run last quarter without a week of manual assembly.
Small blind spots compound. A $4 discrepancy on a fuel transaction is noise. Across 2,000 transactions a month it is $96,000 a year. The same math applies to overservicing, duplicate repairs and unbilled warranty work.
Fleets that get past this build one record per asset where every cost lands automatically.
Uncontrolled fleet costs create operational and financial risk
Poor cost visibility produces consequences that read as operational failures. Unplanned downtime because a service interval slipped. A missed route because no spare was available. Audit stress because documentation was incomplete. A budget overrun discovered in month nine.
Reactive environments inflate costs continuously and quietly. Emergency repairs cost more than scheduled ones. Rush parts orders cost more than planned ones. Towing costs more than a shop visit. None of these arrive as a single catastrophic number, which is why they persist.
The exposure extends past the budget. Missed inspections and thin documentation carry compliance risk. Service failures carry reputational risk with the customers your fleet exists to serve.
Cost visibility changes how fleets are managed and funded
Reliable cost data changes the conversation with finance. A capital request backed by cost per mile trends by asset class, documented replacement thresholds and downtime history carries weight that a percentage increase request never will.
Visibility also enables decisions you cannot otherwise make. Maintenance timing based on actual usage. Replacement based on cost curves. Staffing based on measured technician throughput. Each requires history you either have or you do not.
Fleet leaders profiled in Masters of Fleet describe the same shift. Once the cost data became defensible, leadership engaged with fleet proposals on entirely different terms.
See what other fleets actually spend
The Fleet Benchmark Report breaks down cost per mile, maintenance spend and utilization across thousands of real fleets so you can see where yours lands.
Get the benchmark report
The biggest drivers of fleet management costs
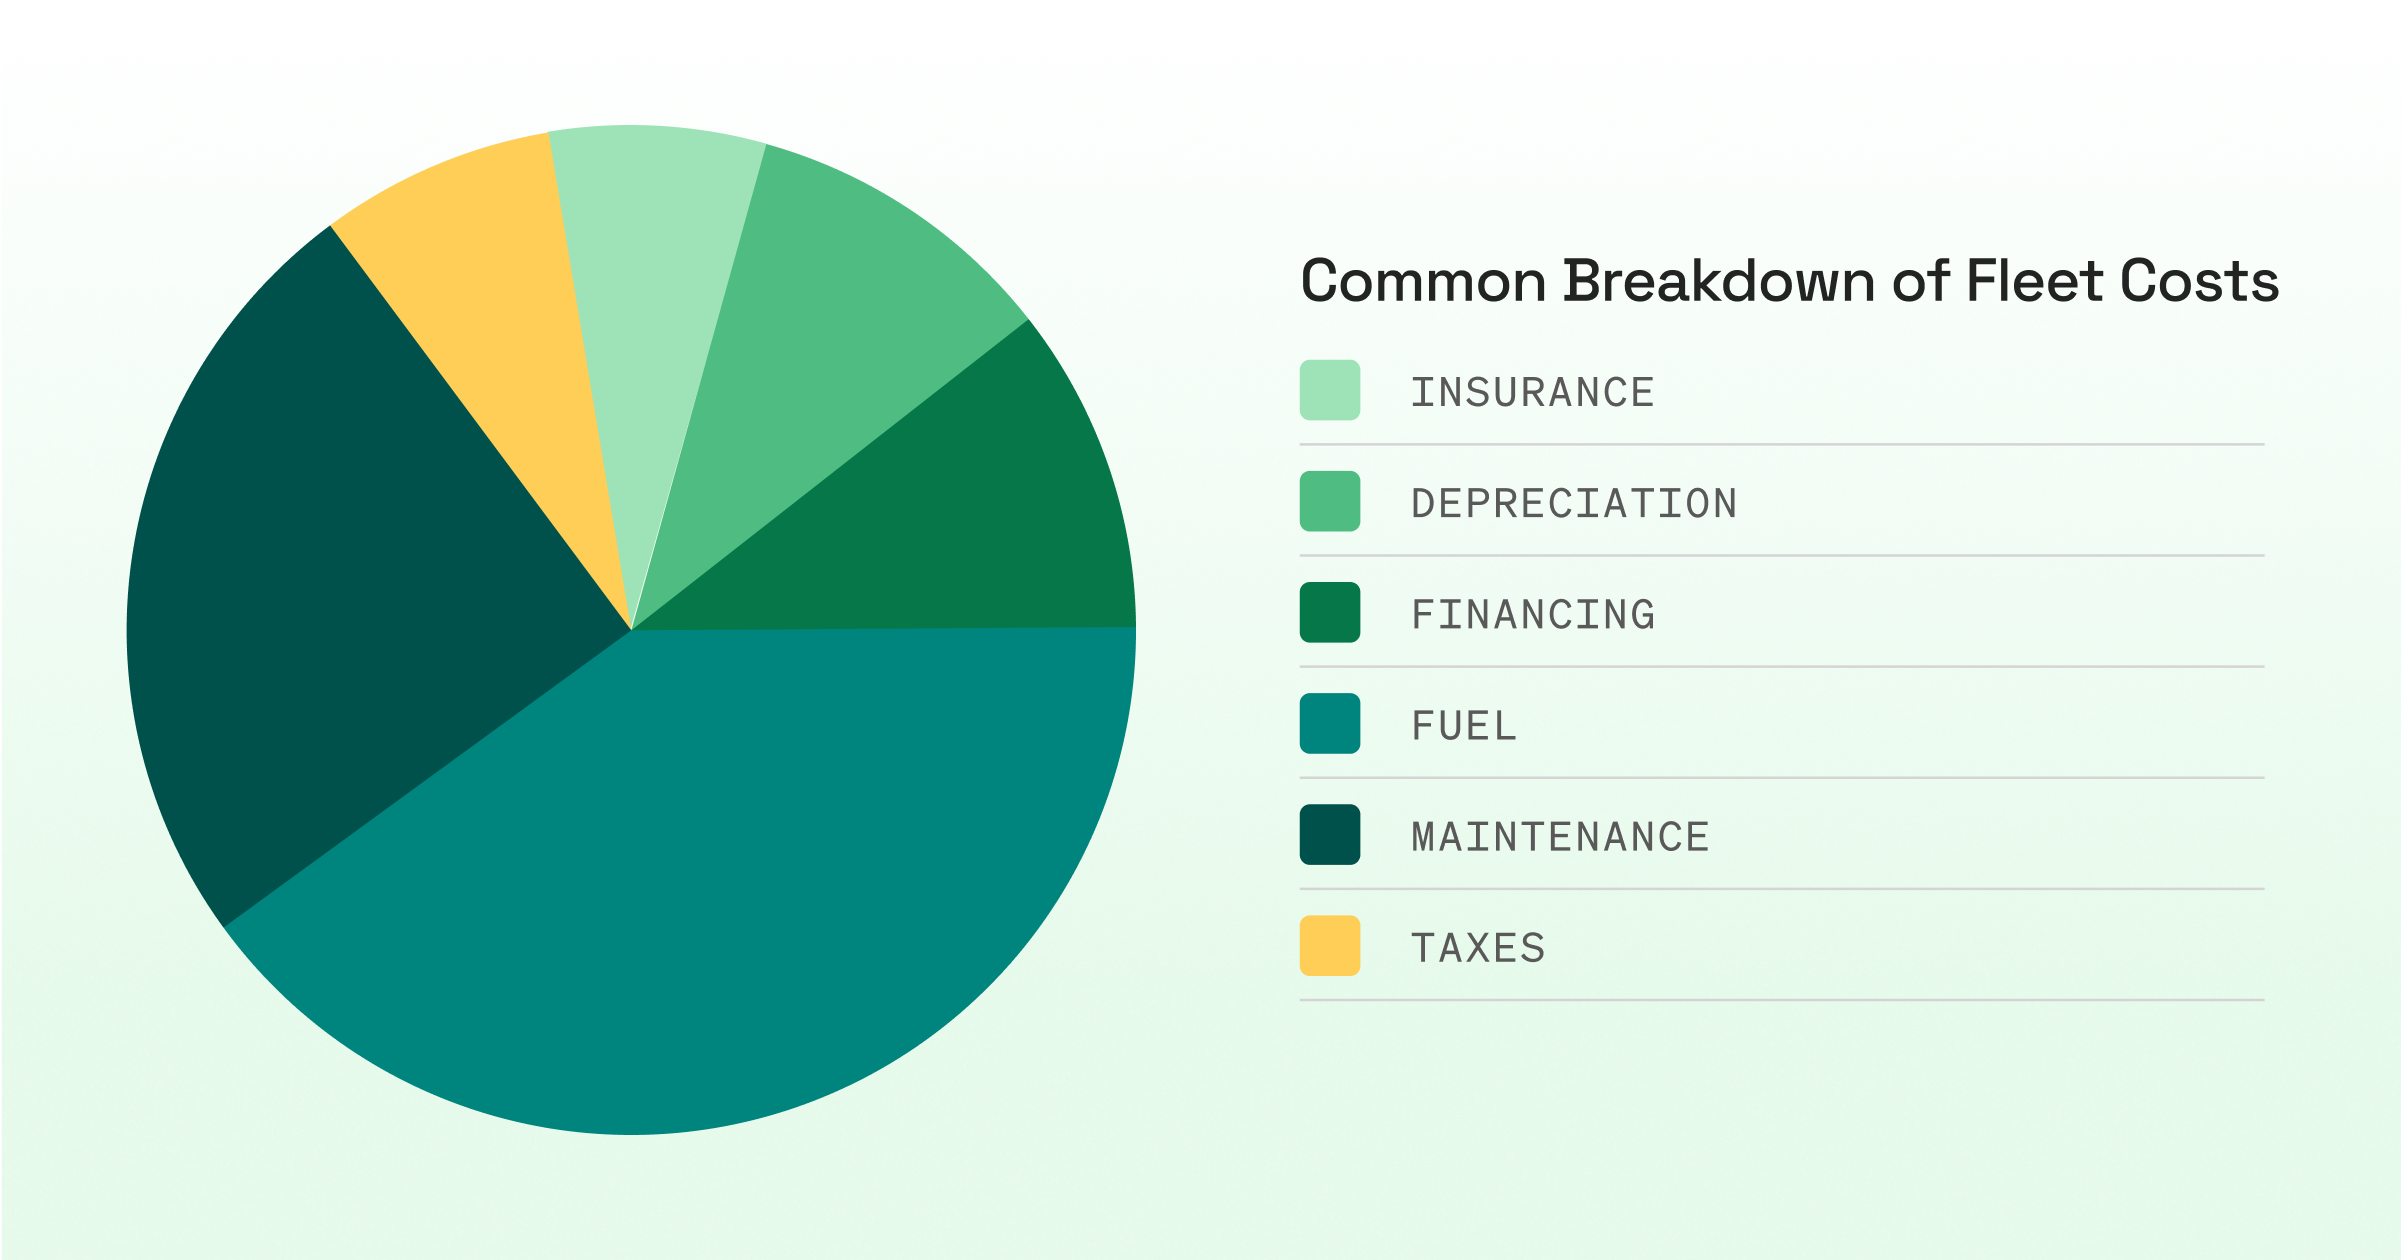
Cost drivers are not equal in size and not equal in controllability. Fuel price is largely external. Fuel consumption is largely internal. Sorting drivers along both axes tells you where effort pays.
They also interconnect. Deferred maintenance raises downtime. Downtime raises overtime. Overtime raises admin load. One weak preventive program shows up in four separate budget lines.
Use the ranges below as a directional starting frame, then replace them with your own numbers. Actual proportions vary considerably by fleet type, duty cycle and asset age.
| Cost category | Typical share of total spend | How controllable |
|---|---|---|
| Fuel and energy | 25% to 40% | Consumption yes, price no |
| Maintenance and repairs | 15% to 30% | High |
| Depreciation and capital | 15% to 25% | Moderate, through timing |
| Labor and admin overhead | 10% to 20% | High, through automation |
| Insurance, tax and compliance | 5% to 15% | Low to moderate |
| Downtime and lost productivity | Rarely measured | High, through prevention |
Maintenance and repairs
Maintenance is simultaneously one of the largest cost categories and the one you hold the most leverage over.
Reactive repairs cost more than planned ones in every dimension. Parts get sourced at rush pricing. Labor gets billed at emergency rates or pulls technicians off scheduled work. The asset sits out of service longer because nobody planned for its absence.
Trends carry the signal. One expensive repair means nothing on its own. A pattern of rising repair frequency on a specific model, a specific route or a specific assignment means something you can act on. That requires repair history captured consistently enough to compare across assets, which is the core argument for centralized fleet maintenance management.
Fuel and energy
Fuel is usually the largest single line and the most volatile. Prices move weekly, and the Energy Information Administration publishes regional diesel averages that make a useful baseline for what your fleet should be paying.
Lack of visibility is what turns fuel from an expense into a leak. A transaction that exceeds an asset's tank capacity. A purchase logged 40 miles from where the asset's GPS places it. A card used twice inside ten minutes. Each is detectable in seconds with automated transaction data and invisible on a monthly statement.
Consumption is the half you control. Idle time, route density, tire pressure, acceleration patterns and load management all move gallons burned per mile, and those improvements flow straight into cost per mile.
Labor and administrative overhead
Labor covers technician hours, manager time and the administrative work of keeping records straight. The first is visible on payroll. The rest is largely invisible.
Manual processes are the multiplier. Keying fuel receipts into a spreadsheet, chasing paper inspection forms from field locations, reconciling shop invoices against work performed, rebuilding a report because two systems disagree. None of it generates an invoice. All of it consumes salaried hours.
At small fleet sizes this reads as an annoyance. At scale it becomes a structural problem. Twenty assets can be managed on spreadsheets by someone diligent. At 200 the same approach requires either dedicated headcount or accepting that the data is wrong.
Downtime and lost productivity
Downtime means more than an unavailable vehicle. One asset out of service means a crew with nothing to do, a job rescheduled, a customer commitment missed and dispatch spending the morning rebuilding a plan.
It is usually the most expensive hidden cost because the repair invoice captures none of it. A $900 alternator replacement that keeps a service truck parked for two days can cost several thousand in lost revenue and idle labor.
Reducing downtime comes back to catching issues before they become failures and resolving them quickly once identified. Both depend on inspection data flowing into work orders without a manual handoff.
Compliance, safety and audit exposure
Missed inspections and thin documentation carry costs that arrive late and land hard. Fines. Out-of-service orders at roadside inspections. Delayed deliveries. Legal exposure after an incident where maintenance records cannot demonstrate diligence. Insurance premiums that reprice after a claim.
Compliance failures are expensive after the fact, which is what makes them easy to defer. Nothing goes wrong on the day you skip a documentation step. The cost materializes at an audit or in a deposition, often years later, when reconstructing what happened is no longer possible.
Hidden and overlooked fleet management costs
These are common patterns present in most fleets at some scale. Few teams ignore them deliberately. They persist because the data required to see them lives in places nobody looks.
Manual processes and fragmented data
Spreadsheets, paper inspections and disconnected tools produce errors at a predictable rate. Every manual transcription step is a chance for a transposed digit, a missed entry or a form that never makes it back from the field.
Delay compounds the error. A fuel receipt entered three weeks late cannot trigger an anomaly alert. An inspection defect noted on paper and left in a truck cab never becomes a work order.
The deeper cost is institutional. Manual processes store knowledge in people. The technician who knows which units have chronic issues, the manager who remembers which shop overcharges, the dispatcher who knows which route destroys tires. When they leave, that knowledge leaves with them. A system retains it.
Unnecessary third-party repairs and overservicing
Approving a third-party estimate without line-item visibility means approving whatever the shop recommends. Most shops are honest. Honest shops still recommend work that a fleet with full service history would decline.
Without your own maintenance record, you cannot tell whether the transmission service quoted was already performed eight months ago at a different location. You cannot tell whether the recommended interval matches OEM guidance or shop preference. You are validating a recommendation against nothing.
Treat this as governance. Reviewing line items before approval is the same discipline finance applies to every other vendor category, and it works the same way here.
Underutilized or poorly allocated assets
Assets that sit still cost nearly as much as assets that work. Depreciation continues. Insurance continues. Registration renews. The capital stays committed.
Underutilization hides well because nothing goes wrong. A truck assigned to a location that needs it three days a week generates no complaints and no alerts. It quietly consumes fixed cost against minimal output.
Utilization data resolves both allocation and right-sizing. Comparing usage across similar assets shows which ones to reassign, which to retire early and how many the operation actually requires. That last answer is frequently a smaller number than the current count.
How to calculate total fleet management costs
There is no perfect calculation available on day one. Your first pass will have gaps. Accuracy improves as data centralizes and collection gets cleaner, and a rough number reviewed monthly beats a precise number produced once a year.
Start with what you already have. Fuel card statements, maintenance invoices, odometer readings and insurance policies cover most of it. Tighten collection with integrations and automation once the framework is running.
Step 1: Build a complete cost list and decide what counts
Write down every cost category and decide which ones are in scope. Consistency matters more than completeness on the first pass, because a total that changes definition each quarter cannot show a trend.
A working checklist:
- Fixed: depreciation, lease or loan payments, insurance, taxes, registration, permits
- Variable: fuel, tires, parts, corrective repairs, tolls, outsourced labor
- Semi-variable: preventive maintenance, in-house technician labor
- Indirect: downtime, administrative time, compliance penalties, capital tied up in spares
The misses that most often make a total unreliable are downtime, admin time, overlapping or unapproved repairs and vendor spend scattered across departments. Decide now whether they are in or out, then document the decision so next quarter's number means the same thing.
Step 2: Pick your primary metric and timeframe
Pick one or two roll-up metrics. Total cost of ownership and cost per mile handle most fleets. Cost per hour works better for equipment-heavy operations where engine hours describe utilization more accurately than an odometer.
Then fix the timeframe. Monthly for operating control, where you want outliers surfaced while you can still act on them. Quarterly or annual for lifecycle decisions like replacement and capital planning. Mixing timeframes inside one calculation is the fastest way to produce a number nobody trusts.
Step 3: Calculate cost per mile and segment it by asset class
Cost per mile is total operating costs over a period divided by miles driven in that same period. A fleet spending $500,000 across 250,000 miles runs at $2.00 per mile.
For reference, Fleetio benchmark data across customer fleets put the overall average at $0.24 per mile in 2025, with construction fleets at $0.23 and trucking and logistics at $0.31. Class 8 operations run far higher. ATRI's 2026 analysis found the average marginal cost of operating a truck reached a record $2.336 per mile.
Two pitfalls account for most bad CPM numbers. Mismatched time windows, where costs cover a quarter and mileage covers a month. And missing odometer data, where readings get entered sporadically and the denominator becomes a guess. Telematics or fuel card odometer capture fixes the second one permanently.
Segment the result. A fleet-wide average hides the problem assets that produced it. Break CPM out by vehicle class, by location and by age band, and the outliers surface immediately.

Step 4: Use TCO to support repair vs. replace decisions
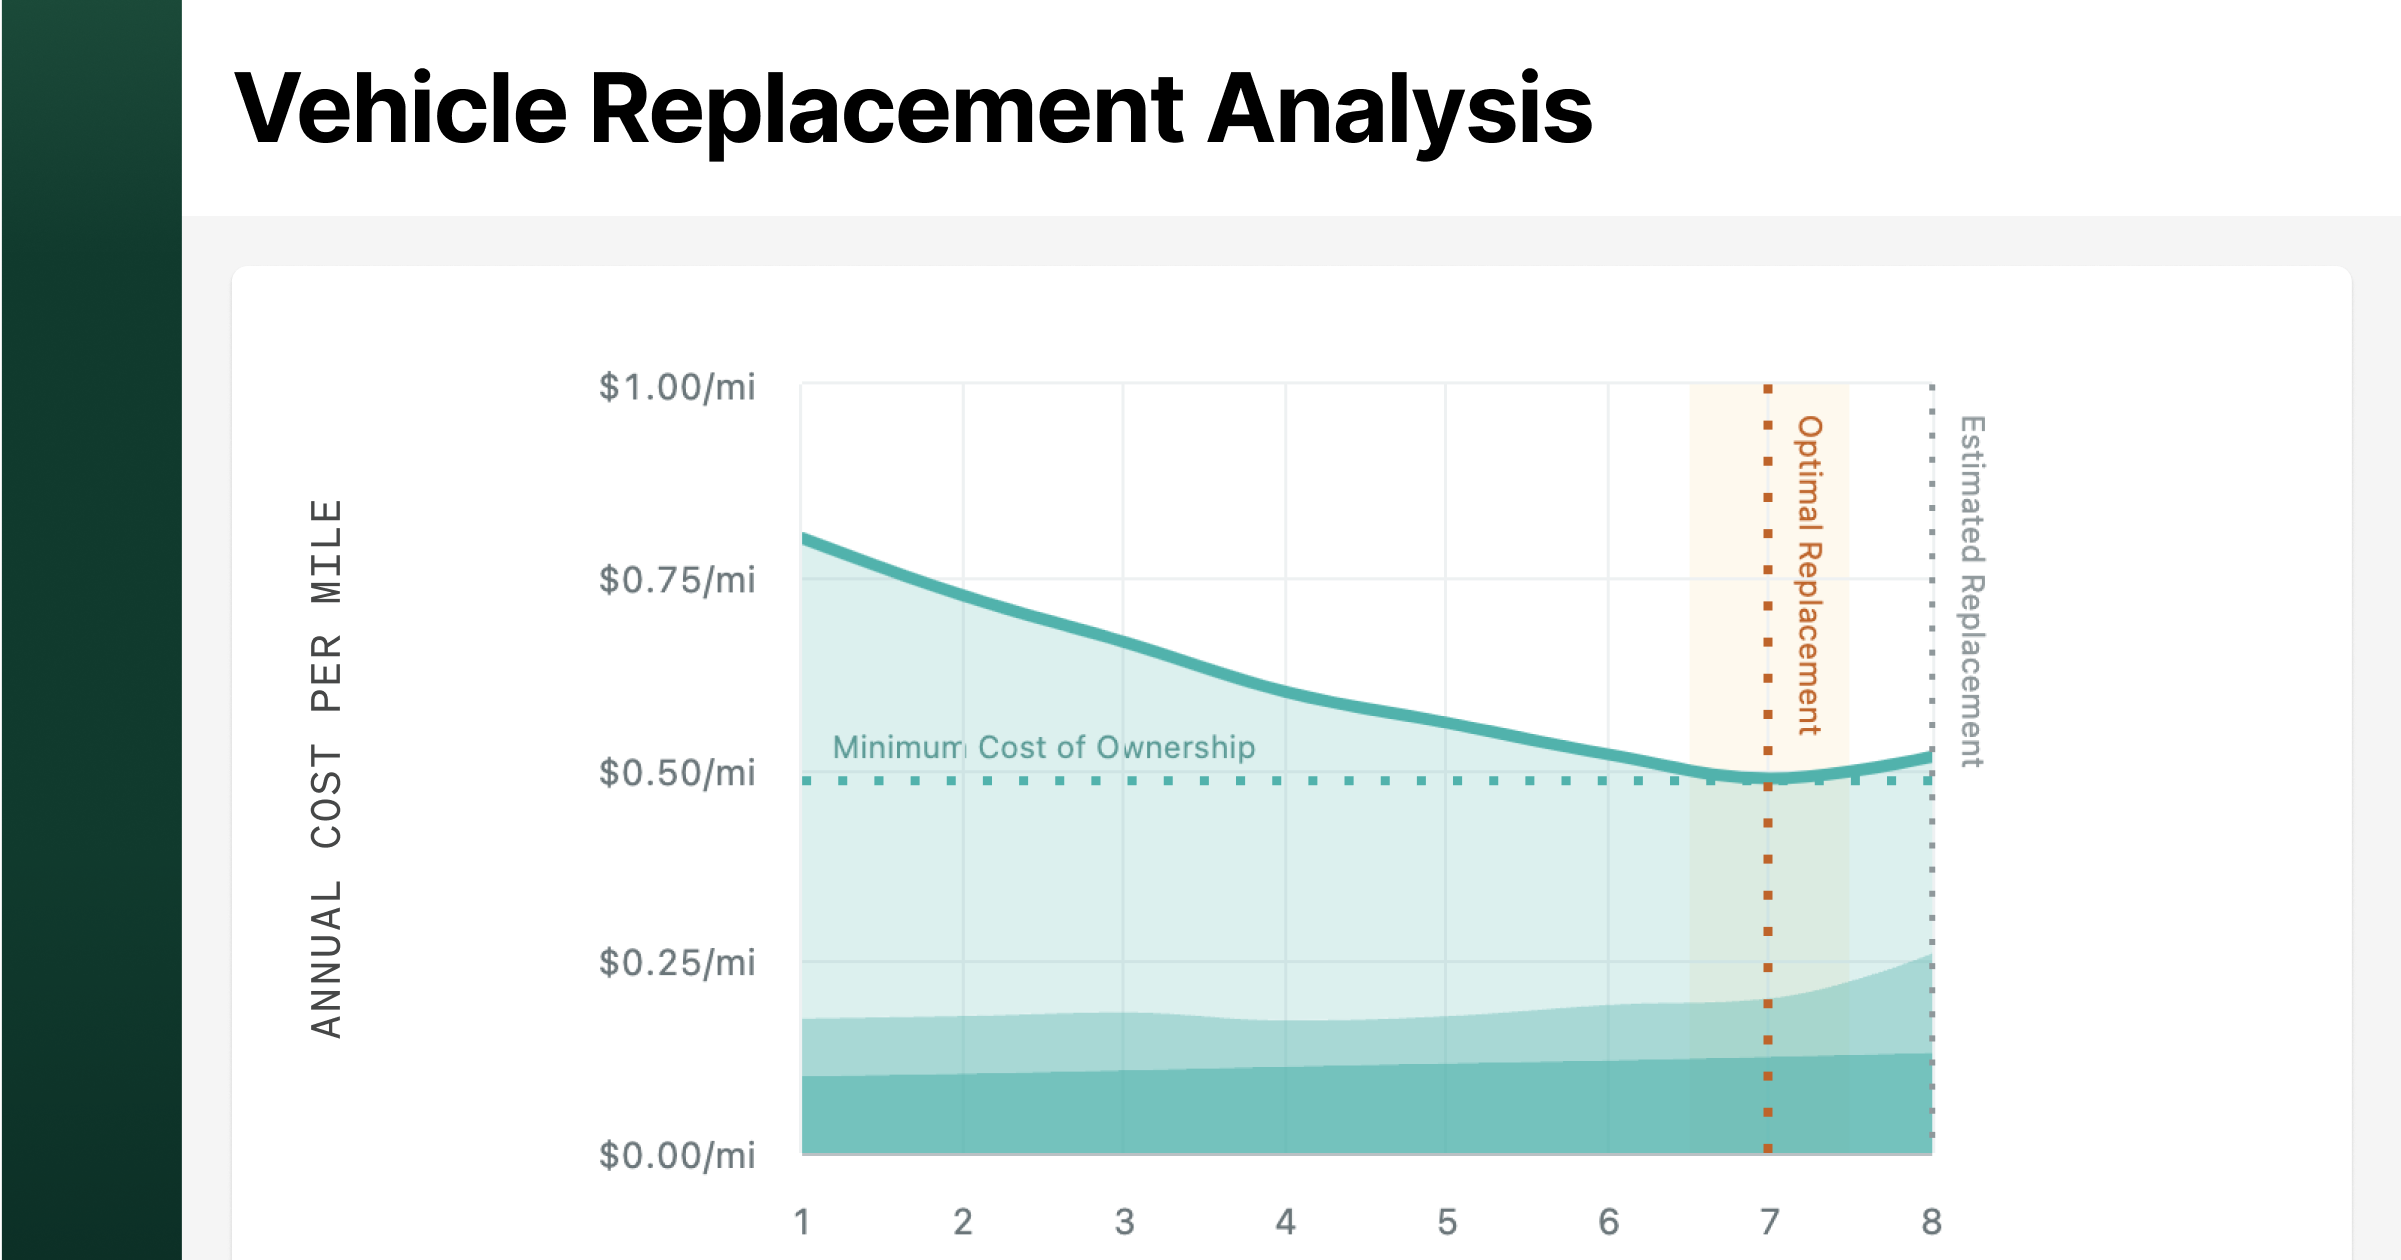
Total cost of ownership is lifecycle cost. Acquisition or lease cost, plus every operating cost across the asset's service life, plus the downtime and risk it generates, measured against the utilization it delivers.
Four signals indicate an asset is approaching replacement:
- Maintenance costs rising year over year on a consistent trend line
- Recurring high-cost repair events on the same systems
- Increasing downtime days per quarter
- Declining utilization relative to comparable assets
A common threshold is to open the replacement conversation once annual operating cost passes roughly 30% of the asset's current value. Treat that as a trigger for analysis rather than an automatic answer.
This step is what makes capital planning defensible. A replacement request supported by five years of cost history, a downtime record and a documented threshold reads very differently in a budget meeting. Our TCO calculation guide walks through the full model.
Step 5: Review monthly, improve inputs and automate what you can
Set a lightweight monthly cadence. Review category totals against the prior month. Flag outliers for follow-up. Reconcile whatever data is missing. Adjust categories when the operation genuinely changes and keep the rules stable otherwise.
Accuracy improves as capture gets less manual. Fuel transactions ingested automatically. Odometer readings synced from telematics. Inspection defects converting into work orders without rekeying. Every removed handoff removes a source of error and a delay.
The compounding return is trust. A fleet that produces the same report every month with numbers that hold up stops spending energy defending its credibility and starts spending it on the operation.
Know what every asset really costs
Fleetio tracks total cost of ownership at the asset level, pulling fuel, maintenance, parts and labor into one running number you can defend.
Explore TCO tracking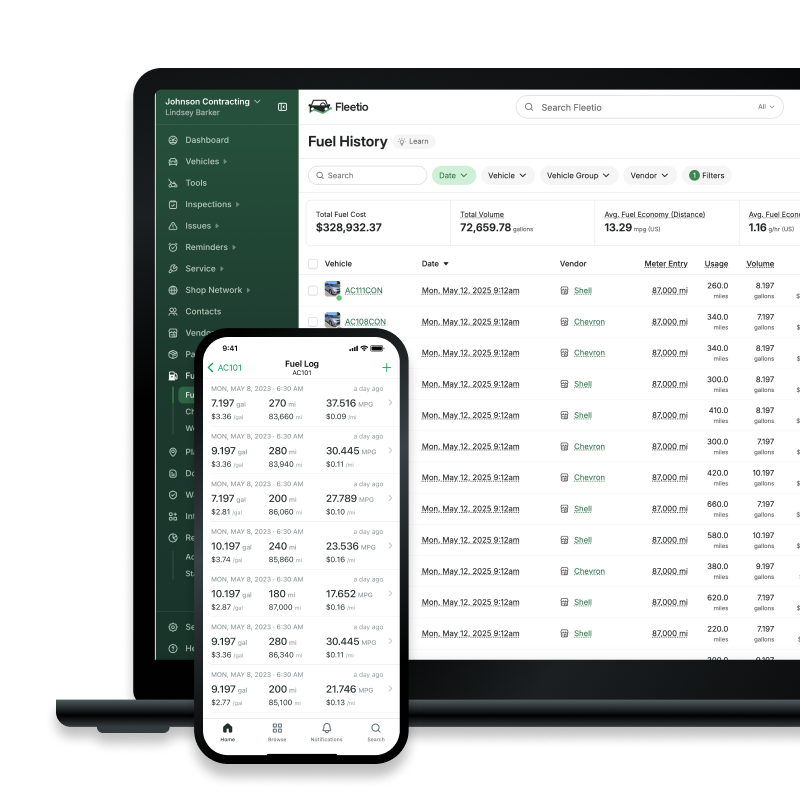
How to reduce and control fleet management costs
Cost reduction that lasts comes from systemic improvement. Deferring maintenance and stretching intervals lowers spend this quarter and raises it next year with interest. Predictability, prevention and accountability are what move the number down and keep it there.
Shift from reactive to preventive maintenance
Reactive maintenance costs more per event, keeps assets down longer and disrupts everything scheduled around them. A failure on the road adds towing, roadside labor rates and a missed job to the repair bill.
Preventive maintenance smooths spending into a predictable baseline and prevents the failure events that produce the spikes. The program works only when schedules reflect OEM guidance and real usage instead of one calendar interval applied uniformly across the fleet.
Fleetio automates preventive maintenance schedules that adjust based on odometer and usage data, so service triggers when the asset has earned it.
Use inspections and early issue detection to reduce costs
Small issues escalate on a predictable curve. A tire at low pressure becomes a blowout. A minor leak becomes a component failure. An ignored brake wear indicator becomes a rotor replacement. Every one of those is cheap early and expensive late.
Drivers are your first line of detection. They interact with the asset daily and notice changes before any system does, provided reporting a defect takes seconds and the report actually reaches someone.
Speed of resolution matters as much as detection. A defect logged and then parked in a queue for a week still escalates. Fleetio's digital inspections turn failed items directly into work orders, which closes the gap between finding a problem and scheduling the fix.
Gain control over outsourced maintenance and approvals
Third-party maintenance is where cost leakage concentrates, because the spending decision happens outside your building. A shop diagnoses, recommends and frequently begins work before anyone on your team reviews the numbers.
Reviewing and approving before money is spent changes that. It also creates a record of what was authorized, which matters when an invoice arrives carrying line items nobody remembers approving.
This is financial governance applied to a vendor category that historically escaped it. Fleetio's Maintenance Shop Network surfaces third-party estimates line by line for review and approval before work starts.
Reduce fuel waste and identify anomalies
Fuel is volatile in price and complex in tracking, which is why it absorbs waste so well. Mixed retail and on-site fueling, multiple card programs, personal vehicle fills and simple overfills all blend into a monthly total that looks roughly normal.
Anomalies only become visible against a baseline. A purchase exceeding tank capacity. A transaction at a location the asset never visited. Two fills within minutes of each other. Consumption drifting upward on one specific unit. Each is obvious when transaction data sits beside asset data and invisible when it does not.
Every gallon recovered lands directly in cost per mile. Fleetio integrates with more than 60 fuel card providers and flags anomalies automatically as transactions arrive.
Eliminate administrative inefficiencies with automation
Manual data entry and reconciliation inflate costs in a way that never shows up in a cost report. The hours already sit in payroll, so nothing looks wrong. What you lose is the alternative use of those hours.
Admin drag compounds with scale. Each new asset adds transactions, invoices, inspections and records. Manual handling grows linearly while the team does not, and something gets dropped.
Accuracy and timeliness are what make cost control possible in the first place. A report built from data entered three weeks late describes a fleet that no longer exists. Fleetio captures fuel, maintenance and inspection data automatically as it happens, which keeps the record current without anyone maintaining it.
How Fleetio helps teams take control of fleet management costs
Centralized data, automated workflows and a proactive maintenance posture make cost control predictable and defensible. The scramble most fleets experience around budget season comes from assembling the picture after the fact. Fleetio maintains it continuously.
- Preventive maintenance scheduling and inspections produce fewer breakdowns, lower repair costs and less downtime.
- Centralized cost tracking and reporting produce accurate TCO, clear cost per mile visibility and budgets you can defend.
- Line-item repair approvals and fuel monitoring reduce waste, block unnecessary spend and strengthen financial governance.
- Automated data capture and workflows cut administrative overhead and return hours to higher-value work.
Industry coverage of Fleetio's analytics approach describes the same pattern showing up across operations that move from manual tracking to continuous data capture.
If you are building the wider program around this work, our fleet management guide series and the fleet management reference guide cover the operational foundations that cost control depends on.
Put your fleet costs on one screen
See how Fleetio pulls fuel, maintenance, inspections and repair approvals into a single cost record for every asset you run.
Request a demo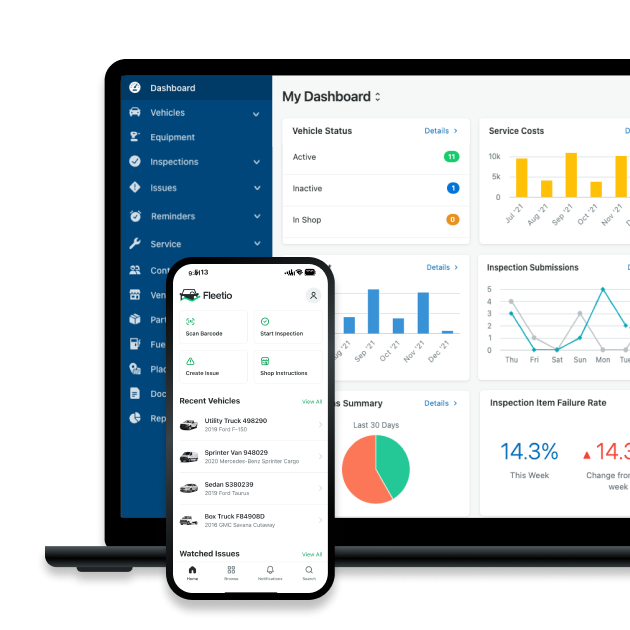
Fleet Management Cost FAQs

Senior Fleet Content Specialist
As a Senior Fleet Content Specialist at Fleetio, Peyton explores the voices and experiences that shape fleet operations. She focuses on how fleet professionals adopt technology, improve efficiency and lead their teams to bring clarity and context to the challenges happening across the industry.
View articles by Peyton Panik
Senior Copywriter
Tyler Freeland is a Senior Copywriter at Fleetio. A former creative writer for Freightliner and Western Star, he now transforms complex (and sometimes common) fleet management topics into practical, engaging insights that fleet professionals can apply every day.
LinkedIn|View articles by Tyler FreelandReady to get started?
Join thousands of satisfied customers using Fleetio
Questions? Call us at 1-800-975-5304