Why 100% Utilization Will Break Your Fleet (and What to Aim for Instead)
Fleet utilization isn’t about hitting 100%. It’s about operating in a resilient window that won’t snap under real-world shocks. Segment predictable vs surge assets, watch the right data (assignments, telematics, rentals, lifecycle), and pre-commit to thresholds so decisions are automatic.
Nov 21, 2025
10 min read
On paper, "100% utilization" sounds like the responsible goal. Every asset is working. Nothing is "wasted." Finance is happy.
But I recently hosted a webinar on utilization with Dylan Lee, General Manager of Logistics at Beach Timber Company (you can find the recording here), and I left even more convinced of something I’ve felt for a while:
100% utilization is a myth worth busting in the fleet world.
Not because vehicle utilization doesn’t matter, but because chasing perfection makes your operation brittle.
I want to walk through the core ideas we shared in the webinar, how Dylan actually applies them on the ground, and a simple way you can start treating utilization as a living system instead of a one-time KPI.
Key takeaways from this blog
-
Retire the 100% utilization myth: Chasing a "full" fleet creates brittle operations where small disruptions cascade into outages. Aim for a sustainable utilization sweet spot that balances efficiency with resilience so cost and risk stay acceptable.
-
Manage by archetype, not averages: Split assets into predictable and surge layers, each with its own utilization targets, KPIs, and decision rules. This dual-playbook approach preserves readiness for volatility without starving day-to-day work.
-
Trade vibes for verifiable data: Ground decisions in four buckets—assignments/reservations, telematics & meters, rentals/outside spend, and cost & lifecycle. Using these together exposes ghost demand, idle clusters, and right-sizing opportunities.
-
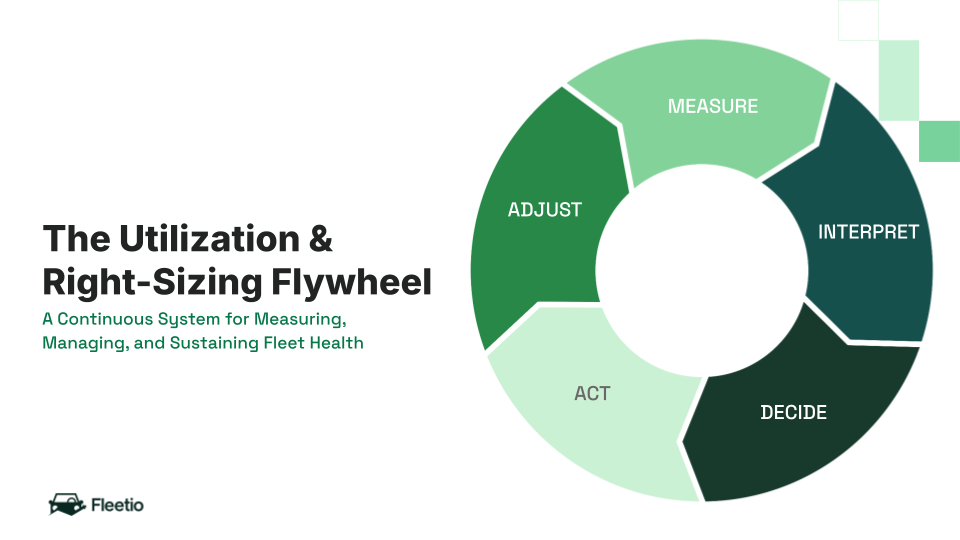
Run a continuous utilization flywheel: Measure → Interpret → Decide → Act → Adjust turns utilization from a one-time KPI into an operating rhythm. Pre-commit thresholds, write a one-page surge plan, and treat deviations as triggers—not surprises.
-
Operationalize resilience with integrated workflows: Set weekly metrics, define decision triggers, and tighten PM compliance and spare ratios so critical units are ready when it counts. Fleetio unifies telematics, PM status, and mobile execution to deliver real-time visibility and repeatable playbooks across predictable and surge layers.
The Problem with “Run It at 100%”
If your target assumes everything will work perfectly, you’ve already lost. When your fleet is running at or near 100% utilization, even minor disruptions become major outages:
- A tech calls in sick and the backlog snowballs.
- A key part goes on backorder and suddenly you’ve got multiple units down.
- A storm or customer surge hits and you have no slack to respond.
Roger Martin calls this the "high price of efficiency" – systems that look incredible when conditions are perfect, but seize up the moment reality shows up.
That’s why I framed the webinar around a different target: not perfection, but a sustainable operating window – what I called the sustainability sweet spot.
Let's say there's a curve:
- On the left: high resilience, higher cost (lots of slack, low risk).
- On the right: high efficiency, high operational risk (no slack, everything has to go right).
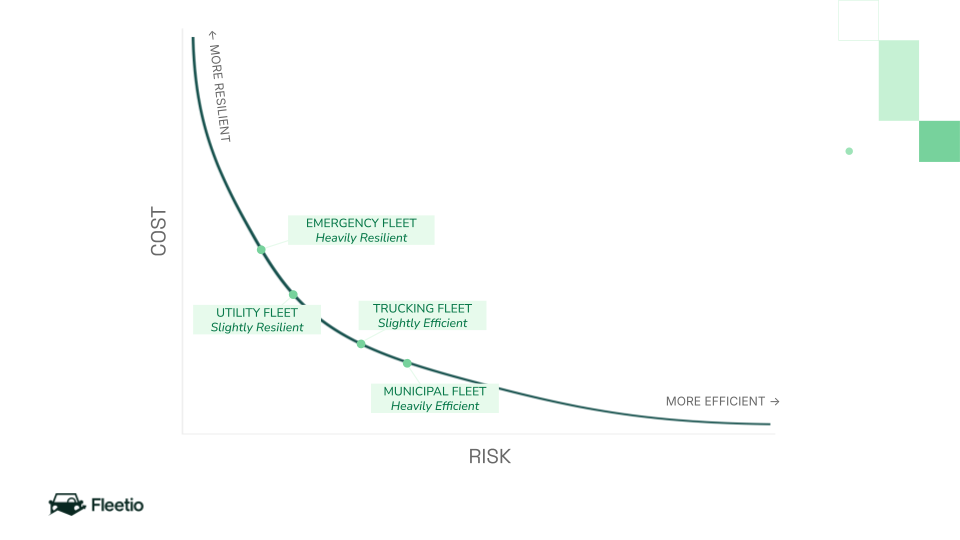
Your job isn’t to slam yourself into the "efficient" edge of that curve. It’s to find the band of utilization where cost and risk are both acceptable for your world, and then defend that band with data, process and clear decision rules.
"We're able to compile data straight from our vehicle through the telematics into Fleetio, and produce utilization metrics on a weekly level. And between all of these, we've kind of found a sweet spot at about 80% utilization rate on our fleet." Dylan Lee, General Manager of Logistics, Beach Timber Company
Step One: Figure Out What Kind of Fleet You’re Actually Running
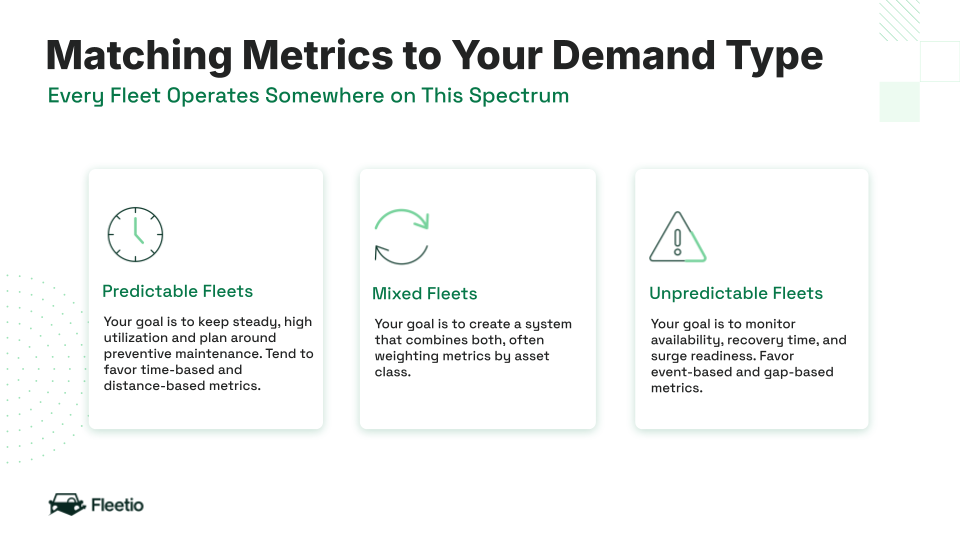
One of the reasons utilization feels so slippery is that "fleet" is rarely one thing. In the webinar, I broke fleets into two archetypes:
Predictable fleets
- Stable, schedulable work: think waste routes, municipal operations, construction with firm schedules.
- Strategy: efficiency through predictability. You can safely run hotter because demand is consistent.
Unpredictable fleets
- Volatile demand: utilities during storm season, emergency response, logistics carriers facing constant disruption.
- Strategy: resilience through flexibility. The win is availability and speed of response, not squeezing every last mile.
Most operations aren’t purely one or the other. Dylan’s world at Beach Timber is a mix: daily, regional deliveries plus extreme spikes during hurricane season when the grid is down and everyone needs poles yesterday.
So instead of managing "one fleet," we talked about managing two playbooks side by side:
- A predictable base: admin vehicles, daily runners, anything on a stable schedule. You can run these hot and tight, measured by time and use.
- A surge layer: specialty gear, storm trucks, line trucks, highly critical or hard-to-rent units. You manage these by readiness and availability.
If you only look at a single, blended utilization number, you hide the real story. The practical shift is simple:
Don’t apply one utilization policy to your whole fleet. Split your assets into mini-systems and give each its own targets and rules.
From “Vibes” to Verified: The Four Data Buckets That Actually Matter
A lot of utilization conversations start with "I feel like…"
"I feel like we don’t have enough trucks."
"I feel like that yard is always packed."
The kids would call that vibes-based fleet management. Not ideal. To replace vibes with reality, I encouraged folks to pull from four data buckets:
#1: Assignments & reservations
- Who claims to need a vehicle vs. who is actually using it?
- Great for uncovering "ghost" demand and vehicles that are always "booked" but rarely moving.
- Odometer, engine hours, GPS dwell time.
- Helps you see hotspots, favorites, and idle clusters.
- Spikes here usually mean your class mix or spare strategy has a gap.
#4: Cost & lifecycle
- Depreciation + maintenance + downtime.
- Helps you decide whether to keep an asset, rotate it, or let it go.
What I appreciate about Dylan’s approach is that they aren’t just looking at vehicle utilization – they’re also tracking driver and technician utilization in the same system. That’s how they landed on an ~80% target utilization as their "just right" zone and caught issues before they turned into habits.
Turn raw data into real action
Track utilization, PM compliance, costs and downtime in one place, and share insights across your team.
View reports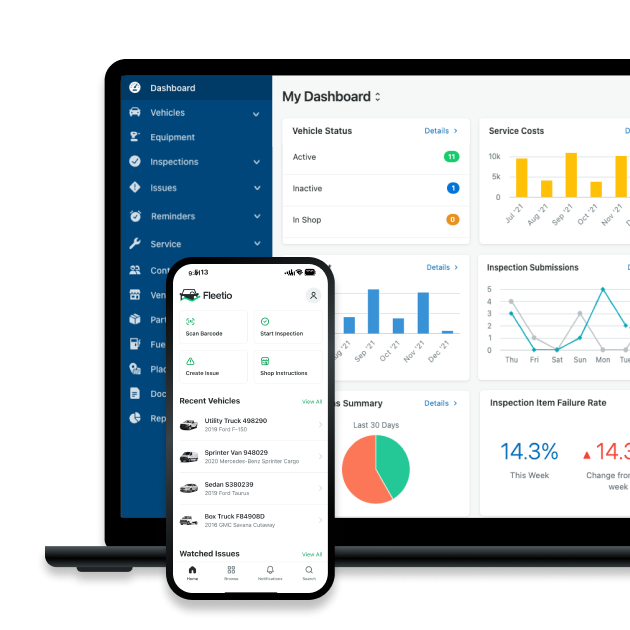
The Utilization Flywheel: A System You Can Actually Run
In the session, I shared a flywheel for turning utilization from a one-time audit into an ongoing rhythm: Measure → Interpret → Decide → Act → Adjust. Here’s the quick version.
1. Measure: Build a single source of truth
This is the "unsexy but essential" phase:
- Clean up your asset list.
- Standardize naming so the same truck isn’t "F-150" in one region and "half-ton pickup" in another.
- Refresh your data ingest (no more "last quarter’s numbers" masquerading as current reality).
If you don’t trust your baseline, you’ll never have the confidence to right-size.
2. Interpret: Ask why, not just what
Instead of "this vehicle is at 40%," ask:
- Is it redundant?
- Is it a seasonal asset in its off-season?
- Is it stuck because of an internal bottleneck like driver availability or assignment policies?
This is where you segment by class, region, use case and time of year to find patterns instead of chasing averages.
3. Decide: Pre-commit your thresholds and responses
This is the step a lot of fleets skip.
The idea is to define clear if-this-then-that rules upfront, so you’re not debating every individual situation later. For example:
- "If utilization on this class is above 90% for four consecutive weeks, we trigger surge rentals or review our spare ratio."
- "If utilization drops below 50% for a month, we freeze procurement on that class and evaluate redeployment or retirement."
Dylan framed it simply: know your target, then treat deviations as decision prompts, not surprises.
"Right now in our fleet, we found our right size is to have two spares of each [asset type]. That way, if and when the unexpected maintenance items come up—or breakdowns come up—we have those assets ready for a driver to hop into." Dylan Lee, General Manager of Logistics, Beach Timber Company
4. Act: Execute the playbook, don’t invent it
When you’re in a surge, you don’t want to be brainstorming. You want to be following a plan you already agreed on.
Acting looks like:
- Moving underused units to hot zones.
- Extending shop hours temporarily.
- Leaning on pre-approved third-party carriers or rentals.
- Rotating assets based on lifecycle (more on that in a second).
5. Adjust: Make the last crisis your new normal
After the quarter ends (or the storm passes) you pause and retune:
- Were our thresholds realistic?
- Did we have enough spares?
- Did our surge plan actually work?
- What do we want to do differently before the next season?
The output of Adjust becomes the new input for Measure. That’s how you build resilience instead of just surviving each peak and forgetting the pain afterward.
The solution to utilization is like any other strategic problem: start upstream, lead with conviction, and build decisions you can actually stick to over time.
A Real-World Stress Test: Hurricane Helene
Last fall, Hurricane Helene hit Beach Timber’s backyard in southeast Georgia.
"Our facility was out of power for six days, and we had drivers on the road. We them from different divisions and it was all hands on deck. I was using the Fleetio Go app during this time, when we didn't have internet access, and it was nice to see our fleet, our people and our teams come together during that difficult time." Dylan Lee, General Manager of Logistics, Beach Timber Company
Here’s what stood out to me in Dylan’s story:
- They’d already decided their "Goldilocks" spare ratio: two spares of each key truck type (with and without knuckle boom cranes).
- They’d already built an integrated view of utilization and PM status using telematics feeding into Fleetio.
- Their PM compliance was tight, so when Helene hit, their trucks were ready to roll, not sitting in the shop waiting on routine service.
Dylan was literally using the Fleetio Go mobile app while the internet was down, coordinating work from his phone and leaning on the spares they’d justified months earlier.
Nothing about that week was "efficient" in the textbook sense. But from a resilience standpoint, it was exactly the point:
- Trucks were available when it mattered most.
- Their team wasn’t scrambling to figure out who owned which decision.
- Customers got poles delivered when they needed power restored.
That’s what the sustainability sweet spot looks like in the wild.
A fleet that didn't flinch
When a six-day outage hit, Beach Timber didn't miss a beat. They kept their trucks rolling, all while maintaining safety, compliance and reliability across their fleet.
Read their story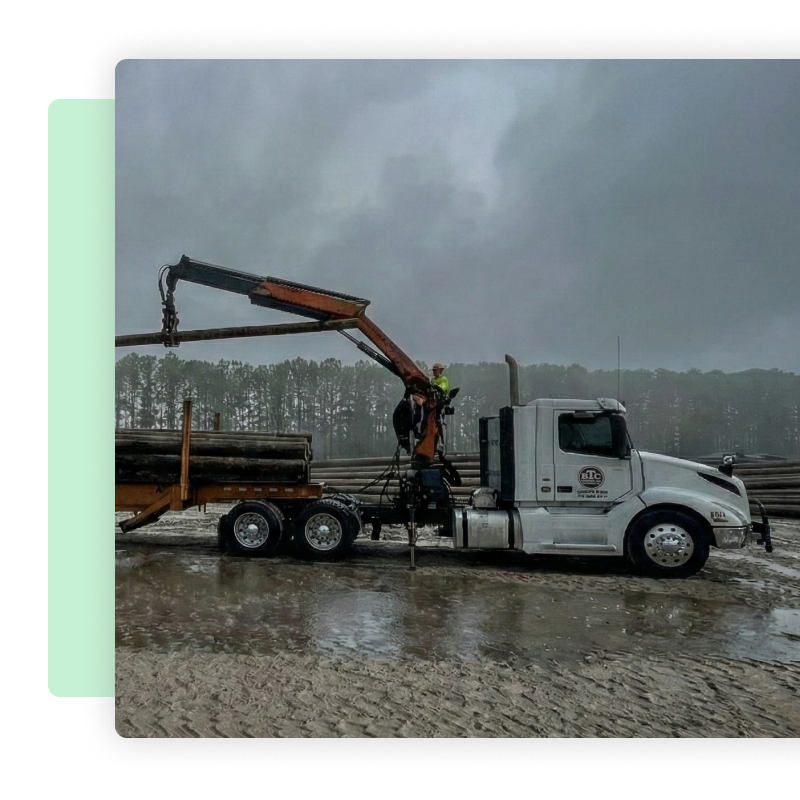
If You Want to Get Started Tomorrow
If you didn’t attend the webinar and you’re just trying to figure out where to begin, here’s how I’d simplify it:
- Pick one utilization metric and track it weekly. Don’t wait for the perfect dashboard. Start with something you actually have data for—hours in use, miles driven, or % of days assigned.
- Split your fleet into at least two groups. Label them "Predictable" and "Surge" (or whatever makes sense for you). Stop averaging everything.
- Define one decision trigger per group. Example: "If our surge assets run above 90% for 4 weeks, we pre-authorize rentals or revisit our spare ratio."
- Write a one-page surge plan. Who calls the shots, what triggers it, which levers you pull first (spares, rentals, third-party carriers, deferred work).
- Rotate one small slice of your fleet by lifecycle. Don’t overhaul everything at once. Take one asset class and pilot the "bee model."
And if you’re already using telematics alongside a maintenance platform like Fleetio, you likely have more of the data you need than you think. You just need to point it at the right questions.
I don’t think the real opportunity is to "squeeze" more out of your fleet.
The real opportunity is to design a utilization system that bends without breaking – one that protects your people, your customers and your budget when the unexpected hits.
If this sparked questions or you want to compare notes on your own sustainability sweet spot, I’m always up for continuing the conversation.
Q&A from Live Webinar

Director of Fleet Content, Fleetio
Zach Searcy is the Director of Content at Fleetio with more than 5 years of experience in the automotive and fleet industries. His content creation days started in middle school when he and his friends began filming lightsaber battles to upload to a new website: 'YouTube.'
LinkedIn|View articles by Zach SearcyReady to get started?
Join thousands of satisfied customers using Fleetio
Questions? Call us at 1-800-975-5304