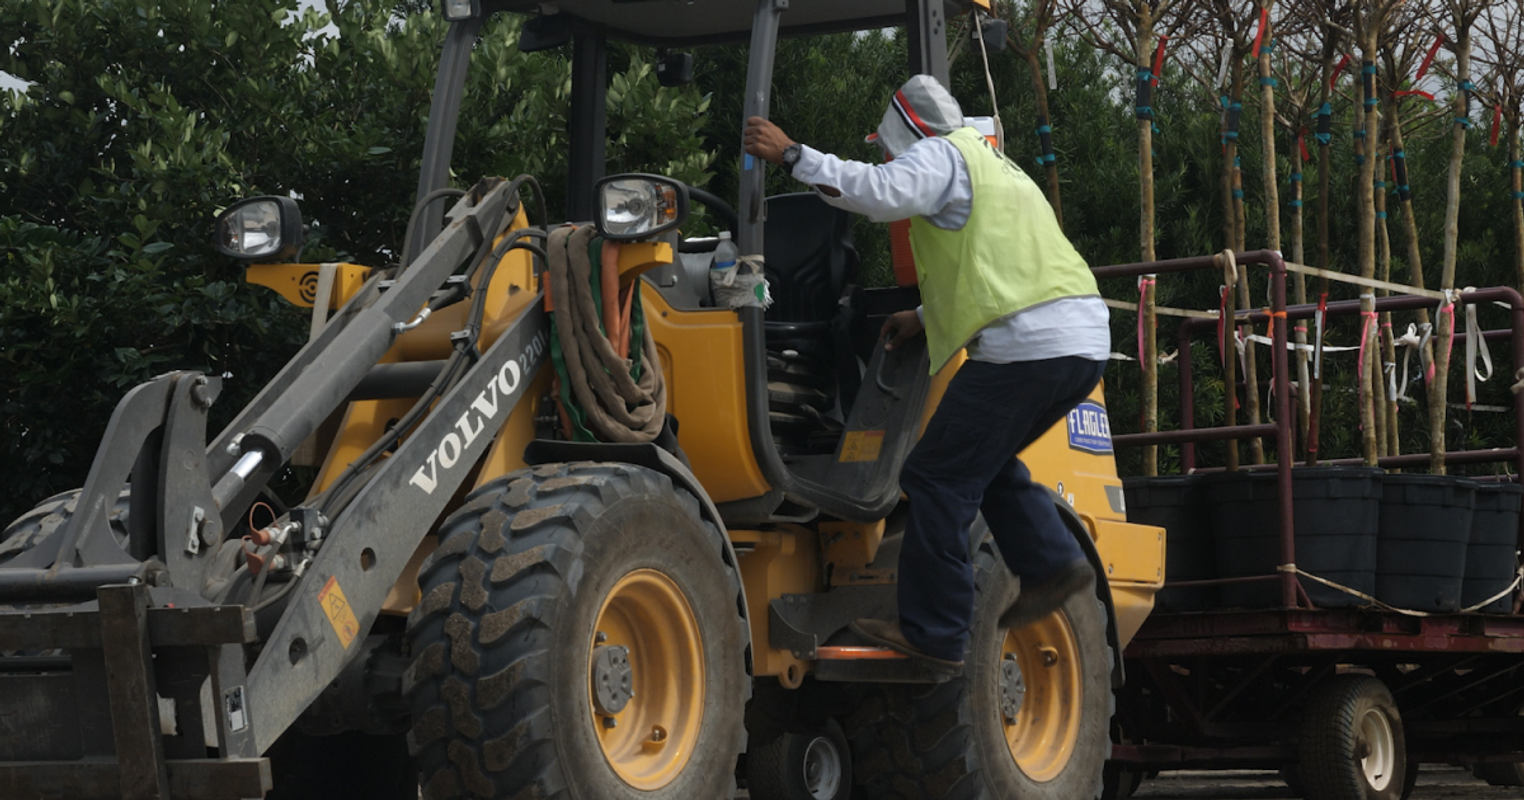
2025 CPM & TCO Insights: Construction Fleets
It costs $0.23 per mile to operate a construction fleet in 2025 — slightly below the national average. But with high mileage and heavy use, managing CPM and TCO is key to long-term efficiency.
Apr 1, 2025
3 min read
Benchmark Snapshot: 2025 at a Glance
According to Fleetio’s 2025 Fleet Benchmark Report:
| Metric | Construction Fleets | Overall Fleet Average |
|---|---|---|
| Miles Driven | 38,447 | 33,368 |
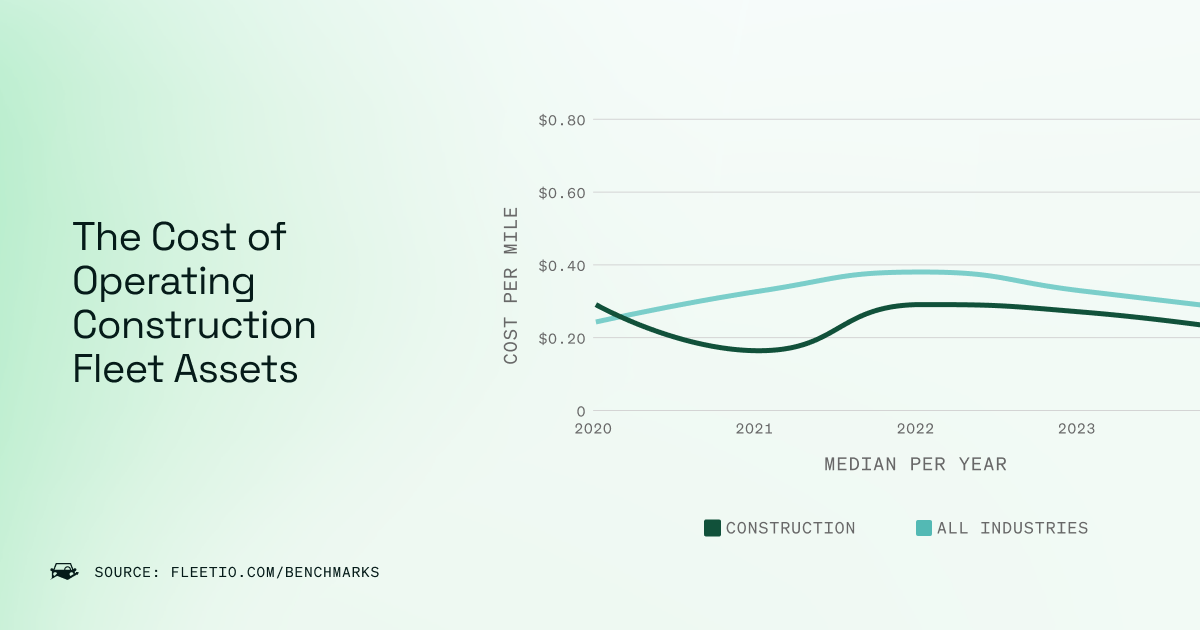
| Cost per Mile (CPM) | $0.23 | $0.24 |
| Fuel CPM | $0.15 | $0.14 |
| Service CPM | $0.05 | $0.07 |
| Total Cost per Asset | $9,436.69 | $10,168.71 |
These benchmarks reflect real-world construction fleet activity — from hauling and idling to rough terrain and unpredictable schedules. With more miles driven and lower TCO than the average fleet, construction operators are proving that efficiency doesn't mean low usage — it means smart usage.
Compare your fleet to the benchmark
See how your construction fleet stacks up. Our 2025 Fleet Benchmark Report gives you actionable metrics to spot gaps, reduce costs, and extend asset life.
Download now
What’s the Total Cost of Ownership for Construction Fleets?
The median total cost of ownership (TCO) for a construction fleet asset in 2025 is $9,436.69, slightly lower than the fleet-wide average of $10,168.71.
What does this mean for construction fleets?
- These vehicles drive more miles than average but maintain efficiency
- Service CPM is low thanks to optimized preventive maintenance
- Fuel is the largest cost driver — especially due to idle time and jobsite conditions
To reduce total cost of ownership, construction fleets should:
- Track usage across all asset types — pickups, trailers, and equipment
- Use PM alerts to avoid unplanned repairs
- Flag underutilized vehicles for reassignment or replacement
Monitoring TCO helps you understand not just what you’re spending, but why — and gives you the insights to lower CPM without sacrificing uptime.
Why Is Construction CPM Unique?
Construction fleets operate under high-pressure, high-wear conditions. These environmental and operational factors have a direct impact on both cost per mile and long-term ownership costs:
- Frequent idle time and stop-start operation
- Off-road and rough terrain usage
- Increased exposure to wear and tear
- A diverse mix of vehicle types and service needs
In this environment, flexibility is key. The most efficient fleets build proactive strategies for cost control — and track metrics that go deeper than fuel or repairs alone.
What’s Driving Up Your CPM or TCO?
If your cost per mile exceeds $0.23 or your TCO feels out of control, look at these common culprits:
- Inconsistent service schedules across fleet asset types
- Aging vehicles that cost more to maintain and fuel
- Underutilized assets creating more cost than value
Fleetio helps you drill down into asset-level performance to pinpoint what’s driving your fleet’s costs — and what to do about it.
How to Lower Your Fleet’s Cost per Mile and TCO
With construction equipment maintenance software, you can take control of both daily operating costs and lifetime fleet spend through:
- Scheduled maintenance tracking across vehicle types
- Utilization reporting to flag idle or underperforming assets
- Cost-per-asset and cost-per-mile reporting for smarter replacement timing
- Mobile inspections to catch issues before they become expensive downtime
Pro-tip
Assets over 10 years old can cost up to 35% more per mile to operate. Use fleet replacement planning to make smarter lifecycle decisions and lower long-term TCO.
Keep Learning
Ready to control construction fleet costs?
Fleetio helps construction fleets reduce cost per mile and total cost of ownership with proactive maintenance, real-time reporting, and smarter lifecycle management.
See how it works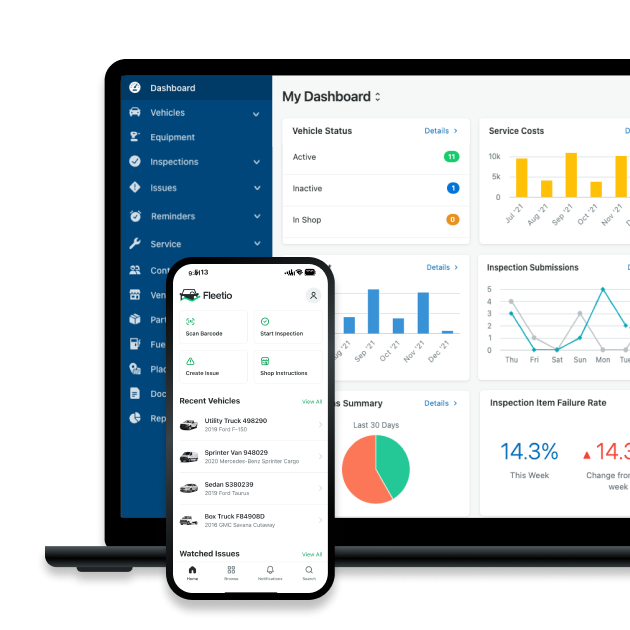

Director of Fleet Content, Fleetio
Zach Searcy is the Director of Content at Fleetio with more than 5 years of experience in the automotive and fleet industries. His content creation days started in middle school when he and his friends began filming lightsaber battles to upload to a new website: 'YouTube.'
LinkedIn|View articles by Zach SearcyReady to get started?
Join thousands of satisfied customers using Fleetio
Questions? Call us at 1-800-975-5304