Fleet Utilization Formula: 4 Ways to Calculate and What to Target
Fleet utilization can tell you which assets are earning their keep, where capacity is going unused and when it may be time to redeploy or replace. Here are four ways to calculate utilization, how to set the right benchmark for your fleet and what to look at before acting on the number.
Sep 14, 2026
19 min read

What you need to know
- The formula is simple. The denominator is what breaks. Dispatch counts every asset in the lot as available. Maintenance excludes anything with an open work order. Finance wants calendar days. Three teams run identical math and produce three numbers.
- Four calculations cover most fleets. Time-based, mileage-based, days-used and schedule utilization each answer a different question. Pick the one that matches the decision in front of you.
- Targets belong to archetypes, not to the industry. Base fleets with predictable routes hold 75% to 85%. Surge and backup fleets should sit near 50% to 65% so capacity exists when demand spikes.
- A percentage diagnoses nothing on its own. Availability, downtime and idle time tell you whether a low number means excess capacity, a shop backlog or a routing problem.
- Cost decides the action. Run utilization against cost per mile and TCO before you redeploy, retire or replace anything.
Utilization formulas are not scarce. Time-based, mileage-based, days-in-use: open any fleet publication and you will find all three within a page of each other. Fleets still stall out, because nobody in the building ever agreed on the denominator.
Dispatch counts every asset in the lot as available. Maintenance excludes anything sitting in a bay. Finance wants calendar days regardless of when your crews actually work. Each department runs the same division, lands somewhere different and the quarterly review turns into a debate about whose utilization is real.
The arithmetic takes a minute. Agreeing on what goes under the line takes a meeting, and skipping that meeting is why most utilization reports never change a decision.
This guide covers the four formulas worth using, how to lock a denominator your organization will honor, what to target based on how your fleet actually runs and how to turn the number into a redeployment, repair or replacement call.
What fleet utilization actually measures
Fleet utilization measures how much of your available capacity your operation deploys. It compares productive time, miles or days against total available time, miles or days, expressed as a percentage. A fleet at 75% left a quarter of its capacity parked during the period you measured.
The metric matters because it ties deployment to cost. An asset in the lot still depreciates, still carries insurance, still renews a registration and still holds capital that could be working somewhere else. Utilization is the fastest way to see which units earn their keep and which ones quietly bill you for standing still.
What utilization tells you
Segment by location and imbalances surface immediately. Site A runs three assets at 95% while Site B runs two at 40%. That is a redeployment opportunity sitting in plain view.
Segment by asset class and you separate the admin sedan that should run hot from the bucket truck that deploys twice a week. Those two deployments may be the only reason a crew can close certain work orders, which makes 20% the correct number for that unit.
What utilization does not tell you
The percentage carries no causation. An asset at 40% could be underused because demand dried up, because it spent 12 days in the shop or because someone deliberately holds it as surge capacity. The number looks identical in all three cases.
It also carries no verdict. Emergency response assets at 95% have no buffer left for the emergency. Delivery vans at 95% are doing exactly what you bought them for. Context decides whether a number is a problem or a plan.
Utilization is not a fleet sizing answer either. Right-sizing pulls in service level commitments, peak demand windows, technician capacity and spare ratios that no single percentage can hold.
Four fleet utilization formulas and when to use each
The right asset utilization formula depends on your fleet type and the decision you are trying to support. Time-based suits service fleets. Mileage-based suits logistics. Days-used handles mixed fleets. Schedule utilization catches the demand gap the other three hide.
| Formula | Calculation | Best for | Decision it supports |
|---|---|---|---|
| Time-based | Productive hours ÷ available hours × 100 | Service fleets scheduled by shift | Staffing, scheduling and PM windows |
| Mileage-based | Miles driven ÷ target miles × 100 | Delivery and logistics fleets where distance tracks output | Route efficiency, fuel budgeting and replacement timing |
| Days-used | Days used ÷ days in period × 100 | Mixed fleets and equipment with varied mission profiles | Disposal candidates and seasonal planning |
| Schedule | Assigned hours ÷ scheduled hours × 100 | Fleets running reservations or assignments | Ghost demand, booking discipline and capacity planning |
Time-based utilization
Productive hours divided by available hours. An asset available for 200 hours in a month and deployed for 160 of them runs at 80%.
Use it when time is what the asset sells. Field service units, shuttle buses and rental equipment all fit. The friction is the word productive. Does an hour parked at a jobsite with the PTO running count? Telematics platforms tend to answer with engine-on time minus idle, which is convenient and frequently wrong for how your crews work. Settle the definition before the first report, then hold that line.
Mileage-based utilization
Miles driven divided by target miles. A policy expecting 2,500 miles a month against an asset that logged 2,000 gives you 80%.
Delivery and logistics fleets favor this because distance tracks deliveries, customers served and revenue. Trucking operations often run a variant, loaded miles over total miles, which measures efficiency instead of activity.
Mileage misreads certain assets badly. A training vehicle runs all day for 15 miles. A utility truck sits at one address for six hours with the engine powering equipment. Low mileage on either unit says nothing about how hard it worked.
Days-used utilization
Days deployed divided by days in the period. Eighteen days out of a 30-day month is 60%.
This one suits mixed fleets where assets have almost nothing in common operationally. It sidesteps the hours versus miles argument by asking whether the asset went to work today.
The tradeoff is resolution. Two hours of use counts the same as twelve. For fleets where showing up is the unit of value, that is fine. For everyone else it hides variation you need to see.
Schedule utilization
Assigned hours divided by scheduled hours. An asset scheduled for 180 hours with 150 hours of assignments against it runs at 83%.
This formula catches what time-based utilization misses, which is the gap between available and actually booked. A unit can be roadworthy, fueled and parked exactly where it should be. If nobody assigns it, it produces nothing.
The catch is that assigned hours have to come from somewhere real. Teams without a system of record end up estimating from memory or a shared spreadsheet. Fleetio's driver assignment records supply assignment duration, mileage and utilization reporting, so the numerator comes from booking history rather than recollection.
Picking a formula is the easy half. Getting three departments to agree on what belongs in the denominator is where the work is.
Defining the denominator: what counts as available
Every argument about utilization is an argument about the denominator. Teams have to decide explicitly whether available means calendar time, shift hours or schedulable hours, and whether planned maintenance, off-shift periods and seasonal standby come out of it.
Each department's instinct is defensible on its own terms. Dispatch wants to know what it could theoretically send out. Maintenance wants credit for the units it currently has in pieces. Finance wants a denominator that matches the depreciation calendar. All three are reasonable, which is exactly why the metric splinters.
Denominator options
Calendar hours or days is the blunt instrument. Total hours in the period, 720 for a 30-day month. Easy to compute and brutal on any fleet that does not run around the clock. An asset working every business hour available to it lands near 33%.
Shift hours cuts the off-hours out. Ten hours a day, five days a week puts the denominator at roughly 200 hours a month instead of 720. Much closer to operational reality, though you now owe yourself a definition of shift hours that holds across roles and locations.
Rentable or schedulable hours also removes planned maintenance windows. If a unit is booked for PM every other Tuesday, those hours were never available to deploy. This produces the highest percentages and demands the most rigorous downtime tracking to stay honest.
How to treat downtime
Downtime is the hardest call in the denominator.
One approach excludes planned downtime and includes unplanned. PM becomes a legitimate reduction in capacity, while a breakdown counts against you because the asset should have been available. It rewards teams for keeping service on schedule and penalizes the deferral habit that creates breakdowns in the first place.
The other approach leaves all downtime in the denominator and tracks it as its own metric. Utilization then measures total capacity deployed, with a downtime rate sitting beside it to explain the gap between what you own and what you used.
Both work. Mixing them inside one reporting period does not.
The definition lock checklist
Write the definition down before you run the first report. A number that changes meaning between quarters cannot show a trend, and a number three teams calculate differently will not survive a budget meeting.
- Name the denominator: calendar, shift or schedulable hours
- State how planned maintenance is treated
- State how unplanned repairs are treated
- State how seasonal standby and backup assets are treated
- Match the definition to the decision, so operations runs on shift hours while finance runs on calendar
- Hold one definition per reporting segment
- Get written sign-off from finance, operations and maintenance leadership
One number every team can defend
See how Fleetio pulls assignments, meter reads and downtime into a single record so utilization stops depending on whose spreadsheet you open.
Request a demo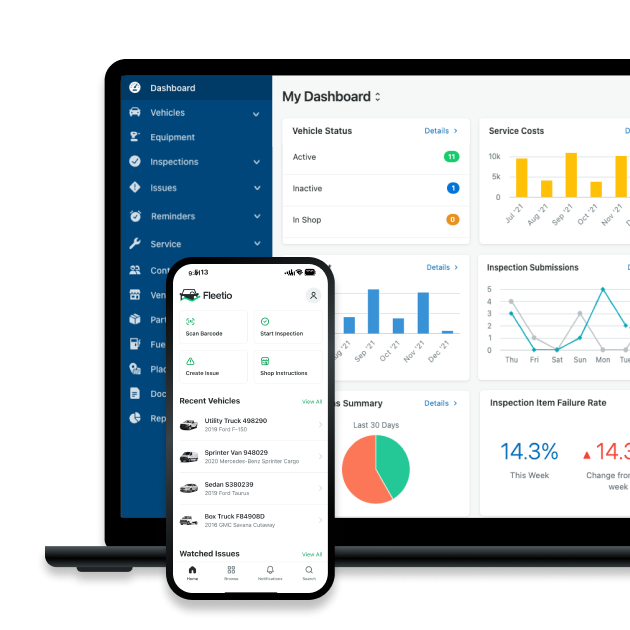
The calculation workflow, step by step
A repeatable calculation defines the asset set, collects the used signals, applies the locked denominator and computes per asset before rolling anything up.
- Define the asset set and the period. Which assets, what date range. Monthly across active assets is the common default. Weekly supports operational calls. Quarterly supports budget work.
- Set available hours or days per your locked denominator. Ten-hour days, five days a week, 200 hours per asset per month.
- Collect the used signals. Odometer readings, engine hours or assignment records, depending on the formula you chose.
- Apply your downtime rules. Subtract planned PM from available if that is your definition. Categorize unplanned repairs so the cause of a low number stays visible later.
- Compute per asset. Used ÷ available × 100. An asset with 160 productive hours against 200 available runs at 80%.
- Roll up by site, team or asset class. A 70% fleet average can mean everything sits between 65% and 75%, or it can mean half the fleet runs at 90% and the other half at 50%.
- Look at the distribution, not the average. Count how many assets fall in each band. The chronically parked and the dangerously overworked both disappear into a mean.
Worked example: same assets, different denominators
Three assets over a 30-day month, 120 productive hours each.
| Asset | Productive hours | Calendar hours (720) | Utilization | Shift hours (200) | Utilization |
|---|---|---|---|---|---|
| Asset 1 | 120 | 720 | 17% | 200 | 60% |
| Asset 2 | 120 | 720 | 17% | 200 | 60% |
| Asset 3 | 120 | 720 | 17% | 200 | 60% |
Identical work, two very different stories for leadership. Calendar-based utilization answers how much of total capacity the fleet used. Shift-based answers how much of operational capacity it used.
Now add downtime. Asset 2 spent 40 hours in the shop for an unplanned repair, and your definition pulls that out of available.
| Asset | Productive hours | Adjusted available | Utilization |
|---|---|---|---|
| Asset 1 | 120 | 200 | 60% |
| Asset 2 | 120 | 160 | 75% |
| Asset 3 | 120 | 200 | 60% |
Asset 2 now reads as your best performer, and it is the unit that spent a week in a bay. That table is the entire argument for companion metrics.
What utilization level should you target
No universal benchmark exists. The right target depends on what your fleet is for, and chasing maximum deployment strips out the buffer that absorbs maintenance windows and demand spikes.
Set targets by fleet archetype
Base or predictable fleets running daily routes and scheduled work can hold 75% to 85%. Demand is known, PM can move to off-hours and surge events are rare. Delivery routes, scheduled service calls and commuter shuttles live here.
Surge or backup fleets should run 50% to 65%. Emergency response units, seasonal equipment and backup capacity for high-criticality work exist because you cannot forecast the day you will need them. The idle time is the product.
Mixed fleets need targets segmented by asset class. Hold sedans and specialty equipment to one number and you will either burn out the sedans or label the specialty units underutilized while they perform exactly as designed.
Why 100% is fragile
A fleet at full utilization has no slack anywhere. One breakdown or one busy week and there is nothing to pull from. When PM comes due, the choice is deferring service or missing an assignment, and fleets in that position usually pick the option that costs more later. We broke down the failure pattern in why 100% utilization will break your fleet.
Dylan Lee, General Manager of Logistics at Beach Timber Company, watches the number weekly instead of pushing it upward. "I track asset utilization and driver utilization every week," Lee says. "Fleetio gives us the visibility to see where every truck stands, so we can run lean without losing reliability."
Running lean depends on knowing where every unit stands. Keep enough buffer for the week you did not plan for.
Constraints that cap your target
- Maintenance capacity. Can the shop absorb the PM load if every asset runs at 85%, or will service start slipping to protect deployment?
- Driver availability. Sometimes the constraint sits on the human side rather than the equipment side.
- Regulatory limits. Hours of service rules cap driver utilization no matter how available the asset is.
- Seasonality. A summer target applied in February produces false alarms.
- Service level commitments. A response time promise implies a specific quantity of ready capacity.
Companion metrics that make utilization actionable
Utilization tells you what happened. Availability, downtime, idle time and cost per mile tell you why, which is the part you can act on.
| Metric | What it measures | What it lets you decide |
|---|---|---|
| Availability rate | Percentage of time the asset is roadworthy | Separates demand problems from downtime problems |
| Downtime hours | Time out of service, planned against unplanned | Targets maintenance backlog or shop capacity |
| Idle time | Engine on but not moving | Finds deployed assets doing nothing productive |
| Schedule utilization | Assigned hours against scheduled hours | Surfaces ghost reservations and booking gaps |
| Cost per mile or hour | Operating cost relative to output | Flags assets that cost more than they return |
| Utilization distribution | Spread across the fleet rather than the average | Exposes outliers hiding inside an aggregate |
The diagnostic logic
Low utilization with high availability is a demand problem. The assets are ready and nobody books them. You are carrying more capacity than the work requires or scheduling discipline has slipped. Reallocate, forecast better or open a disposal conversation.
Low utilization with low availability is a downtime problem. The units are in the shop. Look at repair turnaround, PM compliance and parts availability before you touch fleet size.
High utilization with high idle is an efficiency problem. Assets deploy and then sit with engines running. Routing, dispatch sequencing and operator habits are the levers.
Running these diagnostics every month requires utilization, availability, downtime and cost data in one place. Pulling four numbers from four systems and reconciling them by hand is how the analysis quietly gets skipped. Fleetio's fleet reports and dashboards produce standardized reporting by site, asset class or period, and the utilization summary shows availability, downtime and cost next to the percentage.
Data requirements and where the number goes wrong
Utilization inherits the quality of the data underneath it. Spreadsheets that drift between locations and definitions that vary by branch produce a number nobody will defend in front of finance.
What you need in place
- An asset roster with class and location. You cannot measure what you are not tracking, and you cannot segment without classification.
- Assignment or reservation records. Schedule utilization needs a record of what was booked and for how long.
- Odometer and engine hour readings. Stale meters produce confident nonsense.
- Categorized downtime. Planned PM, unplanned repair or waiting on parts. Without the category, a low number has no explanation attached to it.
- Maintenance event history. Linking downtime to specific repairs traces utilization problems back to recurring failures or parts delays.
Fleetio's telematics integrations with providers including Geotab and Samsara update odometer and engine hours automatically, which keeps the numerator current without anyone rekeying a meter read.
Common pitfalls
Spreadsheets that drift between locations. Every branch keeps its own file with its own formulas. Headquarters tries to roll them up, the totals refuse to reconcile and nobody can tell which site needs help.
Missing or stale meter reads. If the odometer only updates during a PM, you are measuring this month with numbers from last quarter.
Uncategorized downtime. An asset shows 50% and you have no way to tell whether demand was soft or the unit was down for three weeks.
No system of record for assignments. Bookings live in texts, emails and a whiteboard. Nothing captures what was reserved against what was available.
Two rules are worth enforcing on day one. Flag any asset without a meter update in 30 days and go find out why. Require a downtime category on every work order before it can close.
Connecting utilization to TCO and replacement decisions
Utilization is an input to cost visibility rather than a conclusion. Idle assets keep depreciating, which shortens their useful life measured in value delivered instead of years. Paired with total cost of ownership and cost per mile, it starts telling you which units to keep, move or let go.
The path from utilization to action runs through cost. Utilization, then cost per unit of output, then TCO trajectory, then replacement timing.
An asset at 40% is not automatically a disposal candidate. If it is cheap to run and covers a critical backup role, the low number is the job description. An asset at 90% is not automatically a keeper. If repair costs climb while it runs hard, you are watching a replacement candidate accelerate toward you.
Three patterns worth acting on
- Low utilization with high cost per mile. It rarely works and costs too much when it does. Cut it.
- High utilization with rising maintenance costs. It works hard and gets more expensive every quarter. Plan the replacement before unplanned downtime picks the timing for you.
- Low utilization with low cost. Cheap to hold, underdeployed where it sits. Move it to a busier site or pull it into a motor pool.
Bryan Martin, Maintenance Director at Ozark Regional Transit, uses that framing with his board. "When you're looking at cost per mile driven [...] How much is this van costing me per mile? Or how much is it costing my taxpayer per mile?" Martin says. "It's no longer just a procurement decision [...] you now get to look into the full cost of the lifecycle of the vehicles."
Bill Spare, Fleet Manager at the Town of Apex, runs the same analysis against telematics data. "Because of the telematics data that we've been gathering from both Geotab and inputting into Fleetio, we've been able to identify vehicles that are outliers that are costing our fleet more money," Spare says. "So it allows us to target those vehicles for replacement before they can incur any unnecessary costs for the fleet."
If you are building the wider cost picture around this work, our guide to fleet management costs covers the drivers that sit underneath every utilization decision.
Four levers to improve utilization without adding risk
Rotate assets to balance wear
Assets at 90% next to assets at 40% means you are wearing out half the fleet while the other half depreciates in a parking space. Use assignment history and meter data to find the imbalance, then move high-hour units onto lighter routes and push the underused ones toward demand. Balanced wear extends the whole roster.
Cut preventable downtime
Every hour in the bay for an unplanned repair is an hour that was never available to deploy. Track PM compliance next to utilization. When both run low, the availability problem is one you created by deferring service until something broke. Moving toward predictive maintenance shortens that cycle further.
Tighten assignment discipline
Sometimes the assets are ready and the booking process is the constraint. Reservations get made and never used. Assignments happen by text without touching the system. Look for ghost reservations, where an asset shows 80% schedule utilization against 40% actual. Someone is holding time they are not using, and everyone else is planning around a block that does not exist.
Redeploy across locations
A unit at 40% in one branch can close a gap at another. Cross-location reporting is what makes that visible.
Andy Ranson, Fleet Strategy Manager at United Site Services, described the version of this problem most multi-site fleets recognize. "It was very fragmented. Every branch was doing what they wanted to do. There was no visibility between branches, no visibility within regions."
When an asset holds below 30% across several periods with no backup, seasonal or specialty justification, it has become a disposal candidate. Assignment history documents the decision well enough to defend it.
Measure what you can act on
The formula you pick matters less than the three things around it. Lock the denominator in writing so every team produces the same number. Ground the calculation in meter and assignment data nobody has to remember. Connect the result to a specific action, whether that is a rotation this week, a repair this month or a line in next year's capital plan.
Utilization stops being a reporting exercise the moment it changes where an asset goes on Monday.
Put utilization next to the cost of every asset
Fleetio brings assignments, meter data, downtime and cost per mile into one record, so the utilization number holds up in a budget meeting and points at a decision.
Get a demo
Fleet Utilization FAQs

Senior Copywriter
Tyler Freeland is a Senior Copywriter at Fleetio. A former creative writer for Freightliner and Western Star, he now transforms complex (and sometimes common) fleet topics into practical, engaging insights that fleet leaders can apply every day.
LinkedIn|View articles by Tyler FreelandReady to get started?
Join thousands of satisfied customers using Fleetio
Questions? Call us at 1-800-975-5304