Understanding Fleet Data
Understanding Fleet Data: Consolidation and Analysis
The final chapter in our Understanding Fleet Data series looks at everything we’ve covered so far and explores how to tie it all together. We’ll go into detail on how to analyze data and how to affect positive process and operational changes based on the insights gleaned, as well as how to customize reports to quickly find what you need.
Jun 29, 2023
4 min read
Fleet management software (FMS) and solutions work in conjunction to give users powerful insights into the health and operation of their fleet. As more software integrations become available — including finance, human resources and other organization-wide integrations — so does the potential to get bogged down in data. Understanding Fleet Data is a series where we break down the different types of fleet data you can glean from FMS and other solutions to get a better understanding of:
- What data is collected from what source
- How collected data interacts to provide in-depth insights for proactive actions
- How to apply insights practically to improve fleet operations
In the final Understanding Fleet Data installment, we’ll cover how to consolidate collected fleet data for in-depth analysis and explore how proactive analytics can improve overall fleet performance.
Data Collection and Consolidation
Being able to collect an abundance of quality fleet data over time is hugely beneficial when it comes to understanding the good, the bad and the ugly of your fleet operation. While manually collecting this data can prove time consuming and often leads to data gaps, there are numerous solutions available that fleets can use to automate data capture.
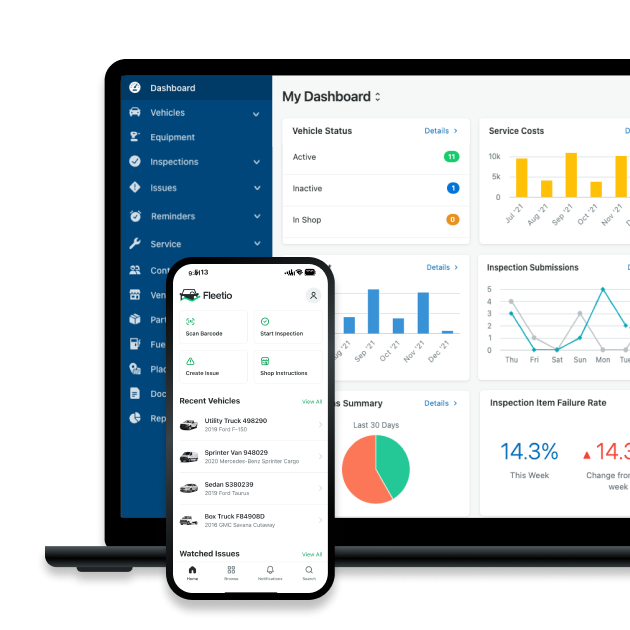
Integrated fleet management systems, like FMS, can collect disparate data from multiple sources, including GPS and telematics, fuels cards and other business and fleet solutions and consolidate that data on one platform to ensure all the fleet metrics you need are front and center on a single, customizable dashboard. But why is data consolidation so integral when it comes to gaining useful insights into fleet?
Throughout the Understanding Fleet Data Series, we’ve covered the different types of data fleets can collect, including the different means available to collect it. Looking at data points separately doesn’t give a full picture of what’s going on in the fleet, however. Data collected from work orders, inspections, parts inventories, fueling and more work together to create a full story as to what caused a breakdown, what’s causing delays in the shop and why fuel spend or consumption has increased, among other things. Being able to nail down the source of issues helps fleets correct those issues effectively and in a timely manner.
A Fleetio walkthrough just for you
Find out how Fleetio makes data consolidation and analysis a breeze!
Schedule demo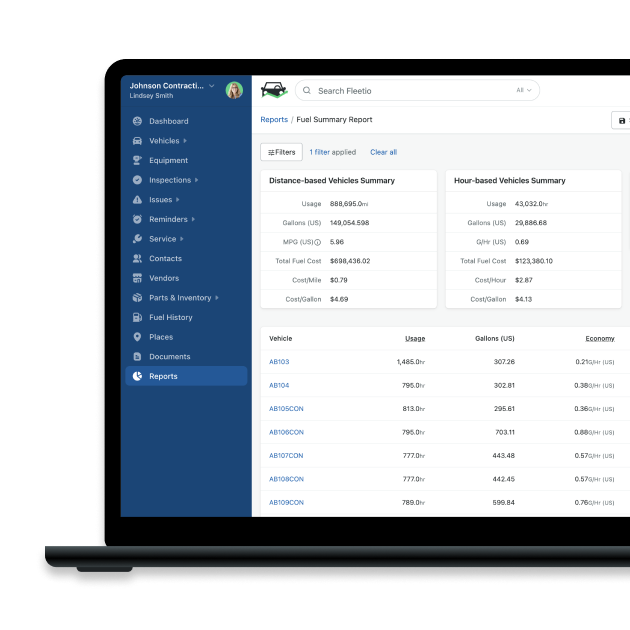
Data Aggregation and Analysis
Data aggregation summarizes data collected from multiple sources, making data analysis easy and increasing the value of data insights. Data collected, consolidated and aggregated using FMS and/or other integrated solutions is displayed in up-to-date fleet reports that express specific metrics from which you can follow an audit trail to source issues.
Let’s take, for example, cost comparison by year for your fleet assets. The cost comparison by year summary aggregates such data as fuel and service expenses, including parts expenses, and other costs associated with each asset over the course of a given year, including loan/lease, insurance, licensing and registration payments. Using such costing data and dividing it by the difference between an asset’s first and last odometer/meter entries for that year, FMS automatically calculates an asset’s average annual cost per meter. Using filterable reports, fleets can then determine which asset has the highest cost per meter compared to similar assets, what the expected cost per meter is for a given make model year (MMY) over its useful life and which MMY is expected to cost the least over its lifetime.
Improve your fleet’s reporting with Fleetio
With that data readily available, fleets can begin to identify such issues as why a certain MMY is underperforming, which can be caused by things like imbalanced utilization (which can be found in a utilization summary) and poor inspection compliance (which can be found in inspection summaries). Additionally, cost comparison by year data also allows for easy vehicle replacement analysis which FMS will calculate for you.
Using FMS and/or other integrated fleet solutions makes analyzing all things fleet much more manageable, as data collection, consolidation and aggregation are done in the background automatically. Regardless of how you decide to collect fleet data, however, it’s important to understand why data consolidation and aggregation is critical to managing your fleet operations and why clean, accurate data collection is integral to gaining actionable insights.
More Series Posts
- Understanding Fleet Data: Fuel
- Understanding Fleet Data: Driver Behavior
- Understanding Fleet Data: Inventory
- Understanding Fleet Data: Maintenance
- Understanding Fleet Data: Usage
- Understanding Fleet Data: Work Orders

Senior Fleet Content Specialist
As a Senior Fleet Content Specialist at Fleetio, Rachael Plant uses her near decade of industry experience to craft practical content aimed at helping fleet professionals tackle everyday challenges with confidence.
LinkedIn|View articles by Rachael PlantReady to get started?
Join thousands of satisfied customers using Fleetio
Questions? Call us at 1-800-975-5304