Understanding Fleet Data
What Is Driver Behavior? How to Measure, Score and Improve It
Driver behavior is how a person operates a vehicle: the speeds they hold, how they accelerate and brake, how long they idle and whether they follow the routes and rules assigned to them. In a fleet, only the part you can measure and tie to a named driver is worth managing.
Apr 15, 2022 | Updated: Sep 22, 2026
9 min read
What you need to know
- Driver behavior is a record, not a judgment call: speed, acceleration, braking, cornering, idling and distraction all leave traces that can be timestamped and tied to a named driver.
- Your existing systems already hold most of the evidence: fuel logs, inspection results, work orders and asset assignments expose behavior patterns before a telematics alert ever fires.
- Behavior shows up as cost, downtime and lost revenue: comparing a driver's assigned asset against a baseline asset turns a vague concern into a dollar figure.
- Coaching works when it is specific and fast: a driver who sees an event the next morning with context around it changes habits more reliably than one who sees a quarterly summary.
Driver behavior is how a person operates a vehicle. It covers the speeds they hold, the way they accelerate and brake, how they take corners, how long they sit idling, whether they wear a seat belt, whether they use a phone behind the wheel and whether they follow the routes and schedules assigned to them.
In a fleet the term carries a narrower meaning. It refers to the actions a telematics device, dash cam, inspection or fuel log can record, timestamp and attach to a specific driver. A manager who says a driver is "hard on trucks" is describing an impression. A manager who says that driver averages 14 harsh braking events per 1,000 miles against a fleet average of four is describing driver behavior.
That distinction decides whether anything changes. Impressions get argued with. Measured behavior gets coached, rewarded or documented.
This post is part of Understanding Fleet Data, a series covering what each type of fleet data tells you and how to use it.
What counts as driver behavior in a fleet
Not every action behind the wheel belongs in a behavior program. The ones that matter share three traits: they are captured automatically, they repeat and they connect to a cost or a safety outcome.
Most fleets group them into four categories.
| Category | What it looks like | Where it shows up first |
|---|---|---|
| Vehicle handling | Speeding, harsh acceleration, hard braking, aggressive cornering | Telematics events and brake or tire wear |
| Vehicle care | Extended idling, overrevving, skipped pre-trip inspections, ignored dashboard warnings | Fuel logs, fault codes, inspection submissions |
| Compliance | Seat belt use, phone use, hours of service, route adherence | Dash cams, ELD records, GPS history |
| Documentation | Late fuel entries, missing odometer readings, unreported damage | Gaps and outliers in your fleet records |
The fourth category gets overlooked. A driver who never reports a curb strike is a behavior problem that only surfaces as an unexplained repair line on a work order months later.
The behaviors that cost fleets the most
Speeding gets the attention because it carries the clearest liability. The behaviors that quietly drain a budget are usually less dramatic.
- Extended idling. An idling engine burns fuel while adding engine hours and accelerating the preventive maintenance clock without moving the asset a single mile. It shows up as a gap between fuel spend and miles driven.
- Harsh braking and acceleration. Repeated hard stops shorten brake and tire life well ahead of schedule. The tell is a vehicle needing unscheduled brake service between preventive maintenance intervals while comparable assets hold their cycle.
- Speeding. Fuel economy falls off sharply above roughly 50 mph, so a habitual speeder costs money on every route before any citation or collision enters the picture.
- Ignoring warning lights. A driver who runs an asset with an active fault turns a minor repair into a major one. Fault data captured through a telematics integration tells you how long the light was on before anyone reported it.
- Distraction. Phone use and inattention rarely appear in the data until a collision or near miss puts them there, which is why dash cams remain the practical way to see them.
Pro Tip
Pick three behaviors to track before you track 12. Fleets that launch with a short list get driver buy-in and clean baselines. Fleets that launch with every available metric get alert fatigue and arguments about the scoring.
Where driver behavior data actually comes from
Telematics is the obvious source. It is not the only one, and fleets without it are not flying blind.
Telematics and GPS. GPS tracking paired with on-board diagnostics captures speeding, harsh acceleration, braking and cornering as discrete events with a time, a location and an asset attached. Most platforms let you set alert thresholds and pull weekly, monthly or annual reports by vehicle or by driver.
Dash cams. Event footage answers the question telematics cannot: why the behavior happened. A hard braking event caused by a vehicle cutting into the lane is a different coaching conversation than one caused by following too closely.
Fuel logs. Compare each asset's projected mpg to its actual mpg over time. A persistent gap points to speeding, aggressive acceleration or long idle periods once you rule out asset age and fuel theft or misuse. A fuel log spreadsheet works for this if you are not yet automating the capture.
Inspections and preventive maintenance. Vehicle inspections and PM schedules work together as an early warning system. If one asset needs its interval shortened because of recurring fail items or wear that its mileage does not explain, look at who has been driving it.
Work orders. Work orders tell you what was repaired and why. Filter out defective parts, recalls and routine failures like flat tires or dead batteries, and much of what remains is behavior-related.
Driver assignments. None of the above means anything without knowing who was in the seat. Asset assignment records are what convert vehicle data into driver data.
Know who was driving what, and when
Set asset assignments for any time period and get a clear audit trail of every driver across your fleet.
Learn more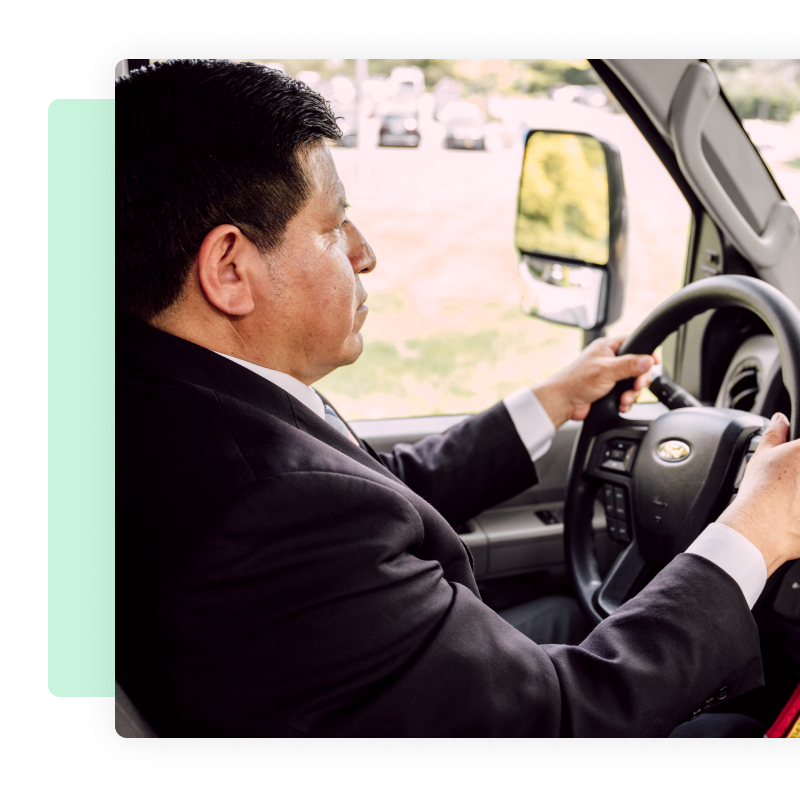
How to measure driver behavior without punishing the wrong people
Raw event counts are unfair and drivers know it. A regional driver covering 3,000 miles a week will always log more harsh braking events than a yard driver, and a city route generates more of them than a highway route.
Three adjustments make a behavior score hold up.
- Normalize by exposure. Score events per 100 or per 1,000 miles rather than per week. Engine hours work better for equipment that runs stationary.
- Group comparable routes. Compare city drivers to city drivers. Mixing route types into one leaderboard produces rankings nobody trusts.
- Use a baseline asset. Pick a vehicle procured around the same time, in similar condition, operated by a driver who meets your standard. The difference between that baseline and the asset in question isolates the behavior from normal aging.
Baselining takes more setup than the alternative of comparing an asset to its own PM schedule. It also produces the number you can defend in a conversation with a driver or a CFO. Fleets running assets across multiple drivers can still do this using assignment records and pre-trip inspection data to close the gaps.
There is no other time better than right now to strengthen all of your [driver] safety and risk management standards. Kris Gault, Embark Safety
What poor driver behavior costs you
Safety is the reason most programs get approved. Cost is the reason they survive the next budget cycle. Three figures make the case.
Maintenance cost. Compare the service history of the asset in question against your baseline asset over the same period. The spread is roughly what that driver's habits are adding to your maintenance spend on that vehicle. Run it across a handful of assets and the pattern either holds or it does not.
Downtime. A status summary report shows how long an asset has been active, inactive, in the shop or out of service, down to the hour. Comparing that summary against the baseline vehicle separates avoidable downtime from the wear any asset accumulates.
Lost revenue. Take the downtime gap between the baseline vehicle and the asset in question, then compare those lost hours to the billable job hours the driver could have worked. That gives you a defensible estimate of revenue left on the table because a vehicle sat in a bay.
Those three numbers also tell you where to spend your coaching time. Ride-alongs and formal training are expensive, so they belong with the mid and high risk drivers your data identifies rather than spread evenly across the roster.
How to improve driver behavior once you can see it
A behavior program that only flags problems creates resentment. One that closes the loop changes habits.
- Set the standard in writing. Define the thresholds, the scoring method and the consequences before you turn on a single alert. Drivers accept a system they understand. See the key elements of a fleet safety program for a starting framework.
- Coach within a day. Feedback delivered while the driver remembers the trip is the difference between a correction and a complaint. Monthly reports are for trends, not for coaching.
- Lead with context. Pull the event, the location and the footage if you have it, then ask what happened before assigning fault. Half of flagged events have an explanation that changes the response.
- Reward the top of the list. Publish the safe driving leaderboard alongside the coaching one. Recognition costs almost nothing and does more for driver retention than most incentive programs.
- Re-measure and document. Track the same metric 30 and 90 days after coaching. Improvement validates the program, and a documented record protects you if the behavior contributes to a claim later.
For drivers whose habits do not shift after coaching, addressing persistent poor driver behavior becomes a risk management decision rather than a training one. Building the behavior data into your broader fleet risk management approach keeps that decision grounded in evidence.
Turn behavior data into something your team can act on
The hard part of driver behavior is rarely the data. Telematics, fuel systems, inspections and work orders each produce plenty of it. The hard part is that the data lives in separate places, so the fuel anomaly, the brake job and the speeding event never meet.
Fleet management software pulls those sources into one record per asset and per driver. Telematics events land next to service history and assignment records, so a spike in harsh braking sits beside the brake work order it caused. Reports that used to take a morning of cross referencing run on a filter.
Once the picture is in one place, coaching stops being a hunch and tracking driver behavior starts paying for itself.
More Series Posts
- Understanding Fleet Data: Fuel
- Understanding Fleet Data: Inventory
- Understanding Fleet Data: Maintenance
- Understanding Fleet Data: Work Orders
- Understanding Fleet Data: Usage
- Understanding Fleet Data: Consolidation and Analysis
See what your drivers are doing
Take a few minutes with our team to see how one platform connects driver behavior, maintenance and cost data in a single view.
Request a demo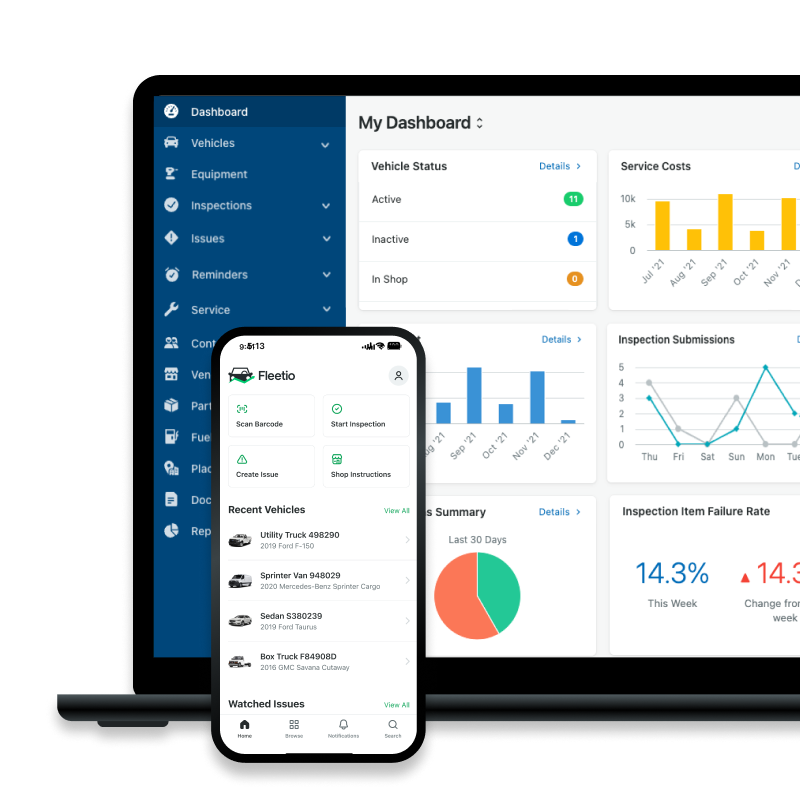

Senior Fleet Content Specialist
As a Senior Fleet Content Specialist at Fleetio, Rachael Plant uses her near decade of industry experience to craft practical content aimed at helping fleet professionals tackle everyday challenges with confidence.
LinkedIn|View articles by Rachael Plant
Senior Copywriter
Tyler Freeland is a Senior Copywriter at Fleetio. A former creative writer for Freightliner and Western Star, he now transforms complex (and sometimes common) fleet management topics into practical, engaging insights that fleet professionals can apply every day.
LinkedIn|View articles by Tyler FreelandReady to get started?
Join thousands of satisfied customers using Fleetio
Questions? Call us at 1-800-975-5304